
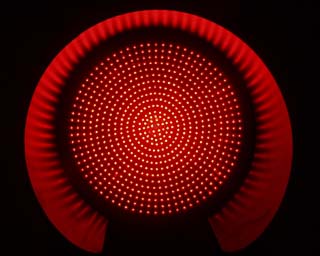
| Close up of red LED traffic signal. The 680 LEDs draw a total of 25 watts of power. |

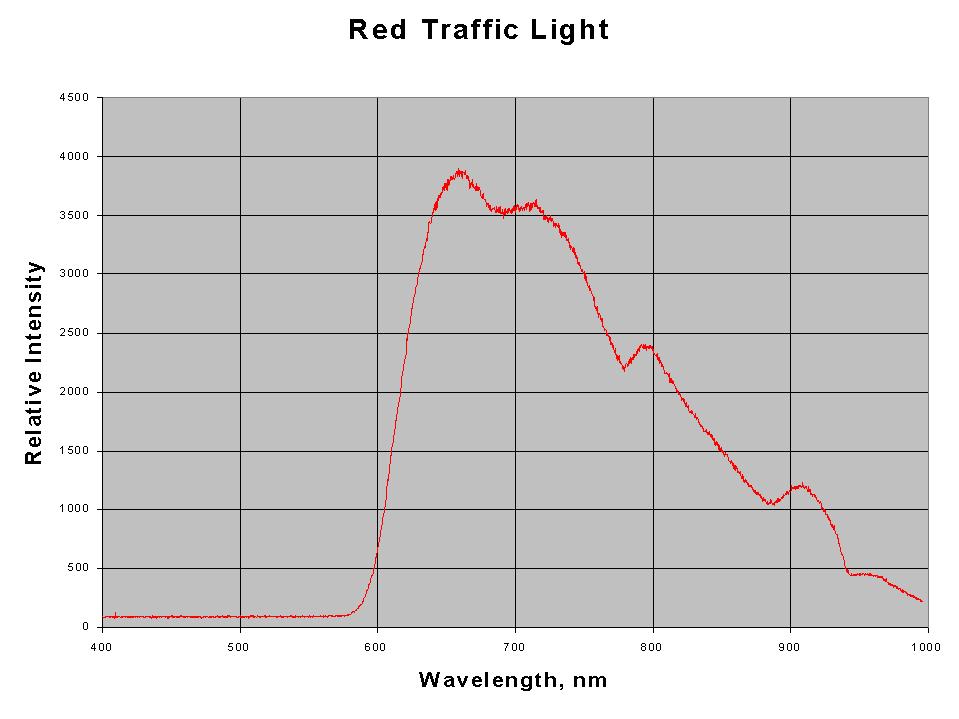
| The narrow band of wavelengths emitted by the red LED traffic light. This emission spectra was collected using a Ocean Optics CHEM2000 Spectrophotometer with a reflectance attachment. |
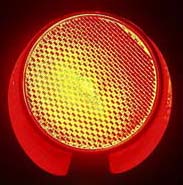
| Close up of red traffic signal using a red, plastic lens in front of a 135 watt incandescent bulb. |
| The broad band of wavelengths transmitted by the red lens. This emission spectra was collected using a Ocean Optics CHEM2000 Spectrophotometer with a reflectance attachment. |
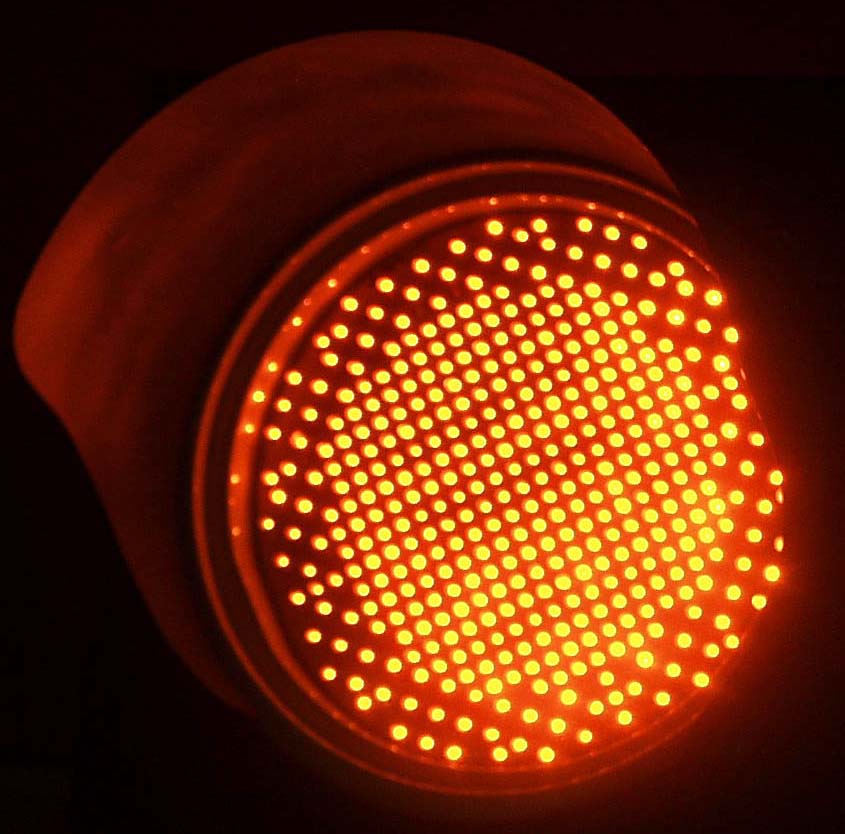
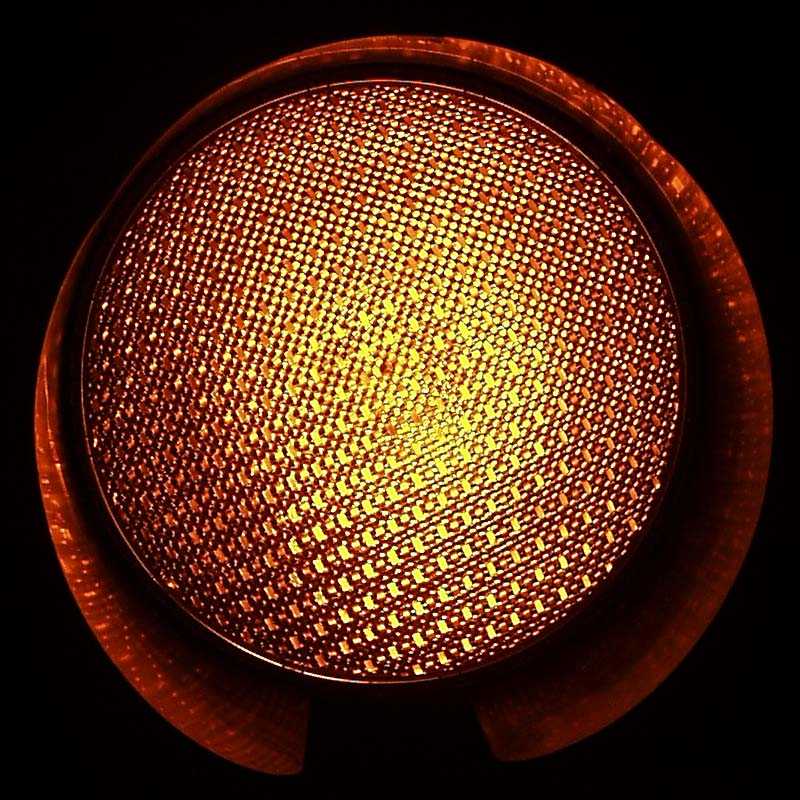
| Close up of amber LED traffic signal. The LEDs draw a total of 25 watts of power. |
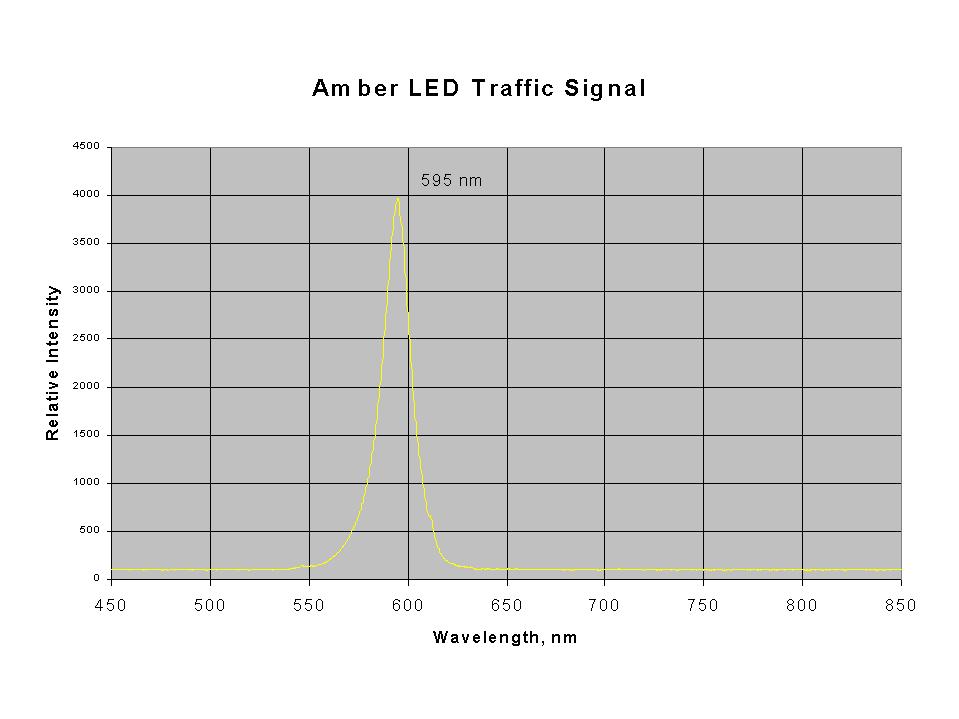
| The narrow band of wavelengths emitted by the amber LED traffic light.
This emission spectra was collected using a Ocean Optics CHEM2000 Spectrophotometer with a reflectance attachment. |
| Close up of amber traffic signal using an amber lens in front of the 135 watt incandescent bulb. |

| The broad band of wavelengths transmitted by the amber lens. This emission spectra was collected using a Ocean Optics CHEM2000 Spectrophotometer with a reflectance attachment. |
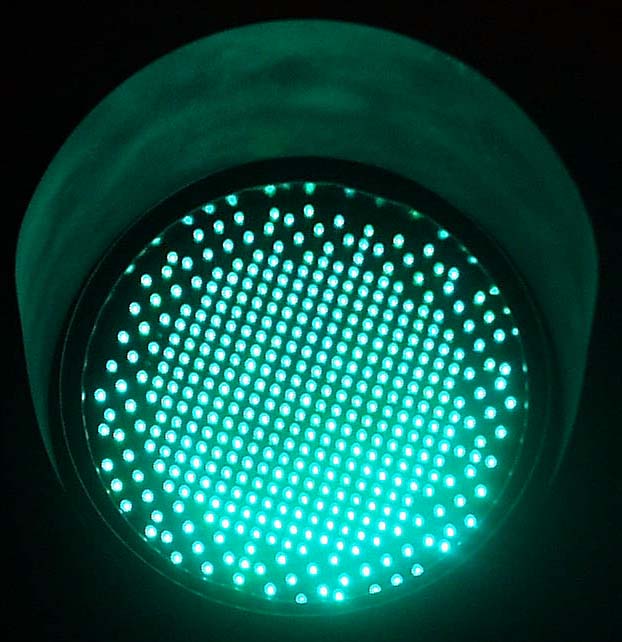
| Close up of green LED traffic signal. The LEDs draw a total of 25 watts of power. |
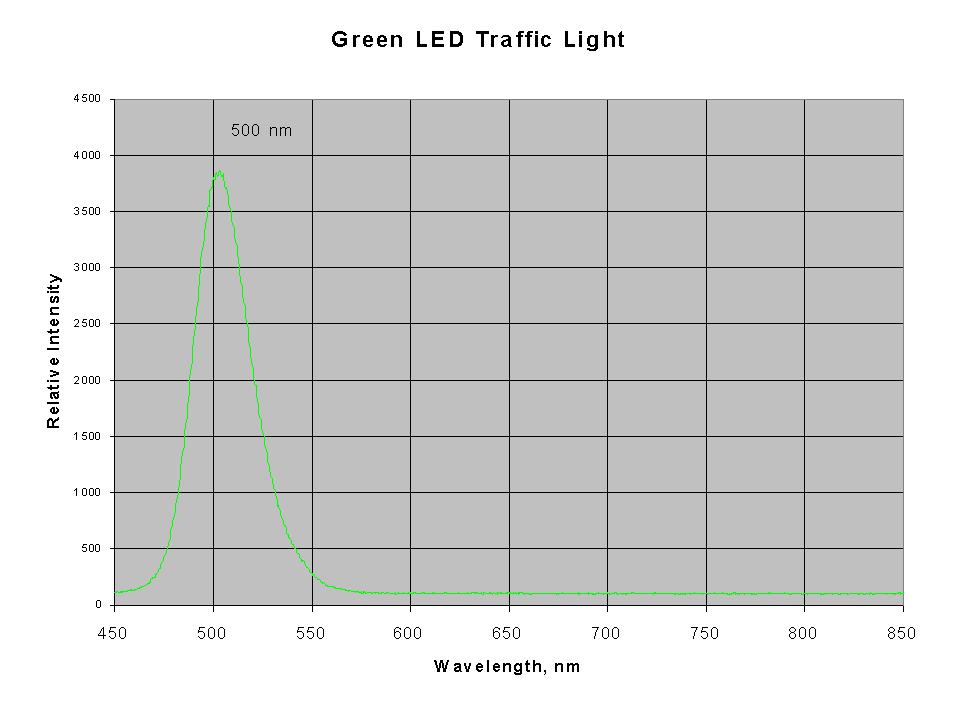
| The narrow band of wavelengths emitted by the green LED traffic light.
This emission spectra was collected using a Ocean Optics CHEM2000 Spectrophotometer with a reflectance attachment. |
|
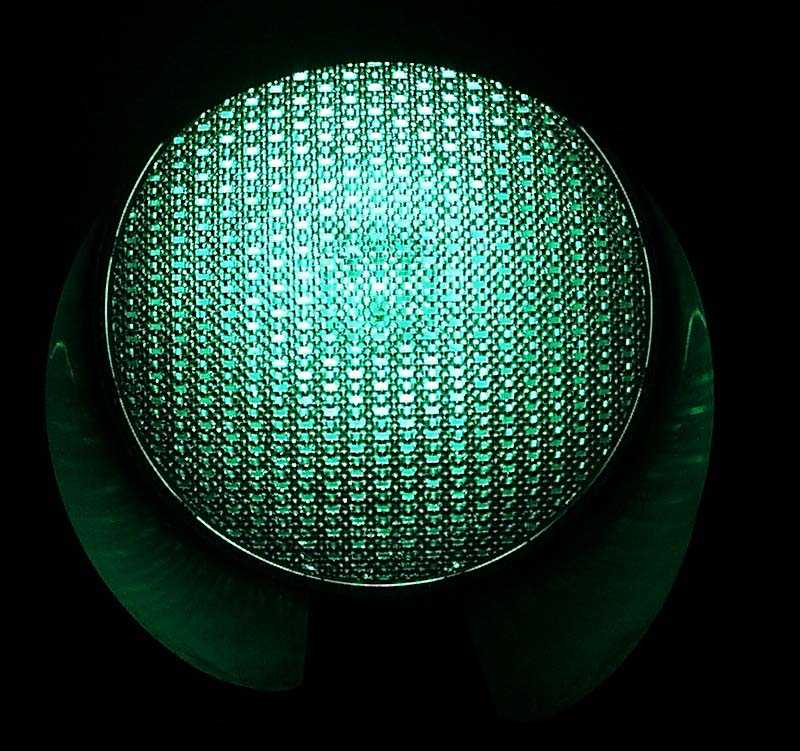
Close up of green traffic signal using a green lens in front of the 135 watt incandescent bulb. |
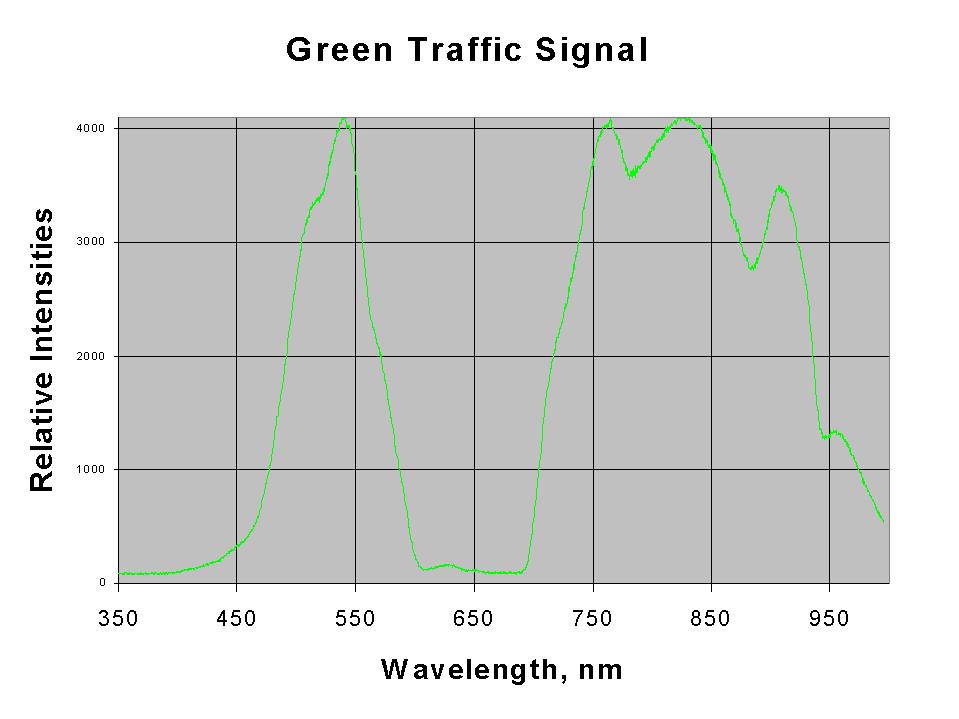
| The broad band of wavelengths transmitted by the green lens. This emission spectra was collected using a Ocean Optics CHEM2000 Spectrophotometer with a reflectance attachment. |
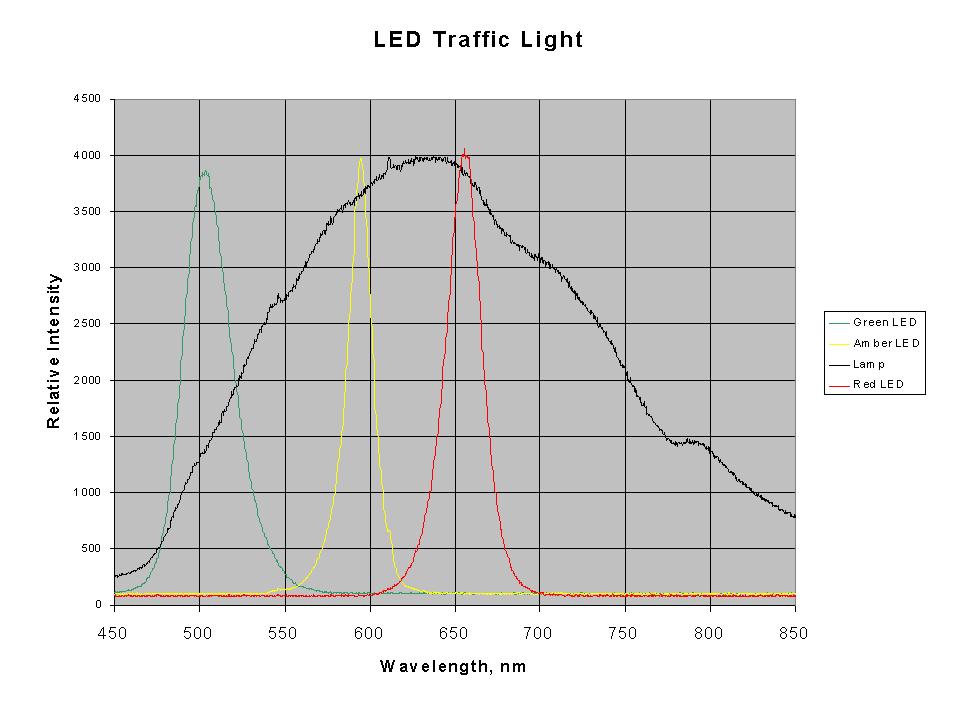
| The narrow bands of wavelengths emitted by the LED traffic lights compared to an incandescent bulb. This emission spectra was collected using a Ocean Optics CHEM2000 Spectrophotometer with a reflectance attachment. |
|
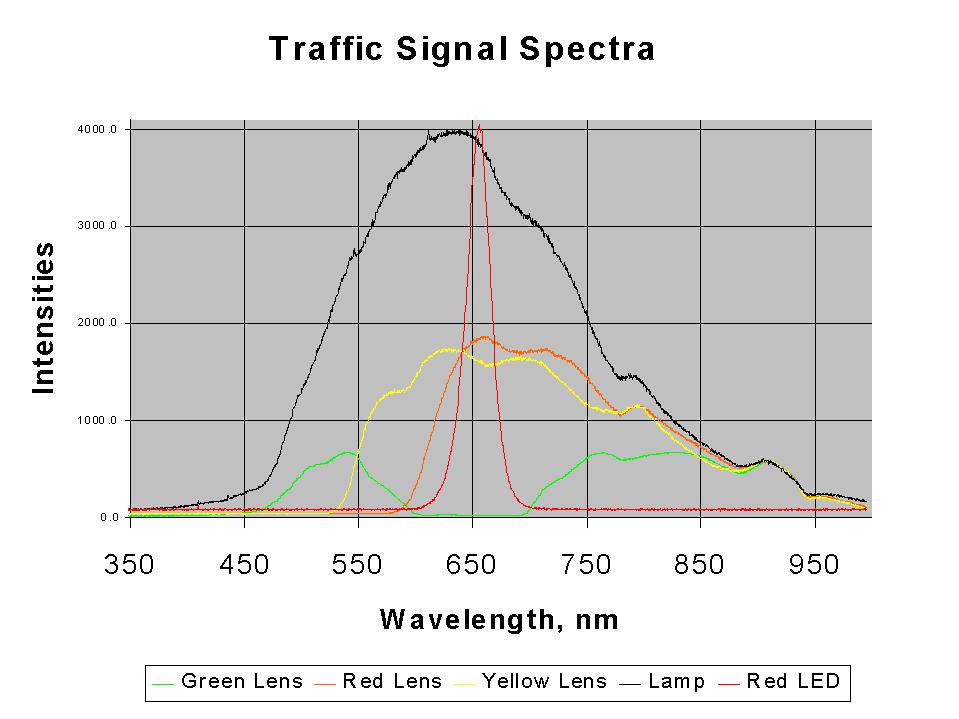
This plot shows the radiation emitted by the 135 W lamp
in white. The light emitted by the red LED is in bright red. The light
transmitted by the red, yellow, and green lens are in dark red, yellow
and green, respectively. The maximum intensities of the curves have
been adjusted and thus can not be compared to one another.
These emission spectra was collected using a Ocean Optics CHEM2000 Spectrophotometer with a reflectance attachment. |