If
you haven't already done so, please read the San
Leandro section on the Camera Towns page
San
Leandro Documents
Some of San Leandro's tickets
can possibly be ignored. If your "ticket" does not
have the Superior Court's name and address on it, it is
what I call a "Snitch Ticket." For more details,
see the Snitch Ticket section on the Your Ticket page.
If you have a San Leandro red light
camera ticket, be sure to look at the Countywide
Information, on the Oakland
Documents page.
East Bay Voters:
Do you live in the South end of Alameda County or the
North end of Santa Clara County - State Sen. Ellen
Corbett's former District?
In 2014 Sen. Corbett "termed out," and
has been replaced by this person

Wieckowski, Author of the anti-motorist bills SB
246, SB
1 and AB 666
who will be running for re-election to the State Senate in 2022 if his current run for Alameda County Supervisor doesn't work out.
In March 2020 please don't vote for
him for Supervisor.
As of 2019 he still is in the State Legislature in Sacramento and was the author of SB 246 of 2019 (had it passed it would have added a 10% tax to each barrel of oil).
In 2017 he was co-author of SB 1 which raised gas tax and car registration fees beginning Nov. 2017 and which was the subject of an attempted repeal, by Prop. 6 on the Nov. 2018 ballot.
In 2013 he was the author of AB 666 which - had it passed - would have increased the number of red light camera tickets.
Before reaching the Legislature he was a member of the Fremont City Council, and during his time on the council he approved two extensions of Fremont's contract with RedFlex: He was the maker of the 2005 motion to extend the contract to 2010, and in 2010 he made the motion to extend the contract to June 2017.
San
Leandro Docs Set # 1
Ticket
Counts
Total
Violations, Notices Printed [4]
| Cam # |
14DA 01 |
14FA 01 |
HAWA 01 |
HAWA 03 |
LEWA 01 |
MATE 01 |
Monthly Average of Notices Printed |
|
|
|||||||||
| E. 14th NWbd @ Davis/ Callan [4] [17] |
Fair- mont NEbd @ E. 14th [4] [17] |
Halcyon Wbd @ Wash- ington [6] [4] [17] |
Floresta Ebd @ Wash- ington [6] [4] [17] |
Lewel- ling Ebd @ Wash- ington [4] [17] |
Marina Ebd @ Tea- garden [4] [17] |
|
Total Notices Printed as % of Violations Recorded [4] |
Total Violations Recorded/ Notices Printed Per Official Monthly CMR Reports [1] [4] |
Total Citations Issued/ Rolling Right Citations Per CVC 21455.5(i) Annual Reports [14] |
|||||||||
| Jan06 |
[5] |
926 |
||||||||||||||||
| Feb06 |
[5] |
926 |
||||||||||||||||
| Mar06 |
[5] |
926 |
||||||||||||||||
| 6 Months Jan-Jun06 [9] |
490 150 |
209 69 |
3375 1366 |
3354 1462 |
- - |
5114 2509 |
44% |
12542 5556 |
||||||||||
| Apr06 |
[5] |
926 |
||||||||||||||||
| May06 |
[5] |
926 |
||||||||||||||||
| Jun06 |
[5] |
926 |
||||||||||||||||
| Jul06 |
[5] [13] |
|||||||||||||||||
| Aug06 |
||||||||||||||||||
| Sep06 |
||||||||||||||||||
| Oct06 |
||||||||||||||||||
| Nov06 |
||||||||||||||||||
| Dec06 |
||||||||||||||||||
| 2006 [2] |
926 (proj.) |
11112 (proj.) |
||||||||||||||||
| Jan07 |
[5] [13] | |||||||||||||||||
| Feb07 |
||||||||||||||||||
| Mar07 |
||||||||||||||||||
| Apr07 |
||||||||||||||||||
| May07 |
||||||||||||||||||
| Jun07 |
583 | |||||||||||||||||
| Jul07 |
[5] [13] | 583 | ||||||||||||||||
| Aug07 |
583 | |||||||||||||||||
| Sep07 |
583 | |||||||||||||||||
| Oct07 |
583 | |||||||||||||||||
| Nov07 |
583 | |||||||||||||||||
| Dec07 |
583 | |||||||||||||||||
| 2007 [2] |
583 (proj.) |
7566 (proj.) |
||||||||||||||||
| Jan08 |
[5] [13] | 583 | ||||||||||||||||
| Feb08 |
583 | |||||||||||||||||
| Mar08 |
583 | |||||||||||||||||
| Apr08 |
583 | |||||||||||||||||
| May08 |
583 | |||||||||||||||||
| Jun08 |
583 | |||||||||||||||||
| Jul08 |
[5] [13] | 583 | ||||||||||||||||
| Aug08 |
583 | |||||||||||||||||
| Sep08 |
583 | |||||||||||||||||
| Oct08 |
583 | |||||||||||||||||
| Nov08 |
583 | |||||||||||||||||
| 36 Months Jun07-May10 [9] |
4384 1443 |
6562 2565 |
9631 4598 |
21051 6999 |
907 275 |
10040 5108 |
40% |
52265 20988 |
||||||||||
| Dec08 |
583 | |||||||||||||||||
| 2008 [2] |
583 | 6996 (proj.) |
||||||||||||||||
| Jan09 |
[5] [13] | 583 | ||||||||||||||||
| Feb09 |
583 | |||||||||||||||||
| Mar09 |
583 | |||||||||||||||||
| Apr09 |
583 | |||||||||||||||||
| May09 |
583 | |||||||||||||||||
| Jun09 |
583 | |||||||||||||||||
| Jul09 |
[5] [13] | 583 | ||||||||||||||||
| Aug09 |
583 | |||||||||||||||||
| Sep09 |
583 | |||||||||||||||||
| Oct09 |
583 | |||||||||||||||||
| Nov09 |
583 | |||||||||||||||||
| Dec09 |
583 | |||||||||||||||||
| 2009 [2] |
583 | 6996 (proj.) |
||||||||||||||||
| Jan10 |
[5] [13] | 583 | ||||||||||||||||
| Feb10 |
583 | |||||||||||||||||
| Mar10 |
583 | |||||||||||||||||
| Apr10 |
[13] | 583 | 690 | |||||||||||||||
| 3 Months Apr-Jun10 [9] |
437 127 |
963 402 |
1644 473 |
2888 594 |
51 7 |
876 468 |
30% |
6832 2071 |
||||||||||
| May10 |
|
583 | 690 | |||||||||||||||
| Jun10 |
690 | |||||||||||||||||
| Jul10 |
[5] [13] | |||||||||||||||||
| Aug10 |
||||||||||||||||||
| Sep10 |
||||||||||||||||||
| Oct10 |
[13] | |||||||||||||||||
| Nov10 |
||||||||||||||||||
| Dec10 [8] |
97 30 |
257 121 |
284 75 |
430 150 |
13 4 |
257 144 |
524 |
39% |
1338 524 |
|||||||||
| 2010 [2] |
649 (proj.) |
7785 (proj.) |
||||||||||||||||
| Jan11 |
505 |
|||||||||||||||||
| 2 Months Jan-Feb11 [9] [13] |
176 66 |
457 197 |
570 208 |
862 338 |
- - |
405 200 |
41% |
2470 1009 |
||||||||||
| Feb11 |
505 |
|||||||||||||||||
| Mar11 [8] |
86 20 |
188 52 |
278 82 |
502 143 |
- - |
275 98 |
395 |
30% |
1329 395 |
|||||||||
| Apr11 | [13] | 446 | ||||||||||||||||
| May11 |
446 | |||||||||||||||||
| Jun11 |
446 | |||||||||||||||||
| 6.4 Months Apr-Oct11 [9] [11] |
584 107 |
1439 568 |
2055 422 |
4421 960 |
- - |
1877 708 |
27% |
10376 2765 |
||||||||||
| Jul11 |
446 | |||||||||||||||||
| Aug11 |
446 | |||||||||||||||||
| Sep11 |
446 | |||||||||||||||||
| Oct11 |
[13] | 446 | ||||||||||||||||
| Nov11 |
||||||||||||||||||
| Dec11 |
||||||||||||||||||
| 2011 [2] |
453 (proj.) |
5440 (proj.) |
||||||||||||||||
| Jan12 |
[13] | 595 | ||||||||||||||||
| Feb12 |
595 | |||||||||||||||||
| Mar12 |
595 | |||||||||||||||||
| Apr12 |
[13] | 595 | ||||||||||||||||
| May12 |
|
595 | ||||||||||||||||
| 9.7 Months Jan-Oct12 [9] [11] |
906 254 |
1633 680 |
2679 729 |
6661 1554 |
4895 2435 |
37% |
16774 5652 |
|||||||||||
| Jun12 |
595 | |||||||||||||||||
| Jul12 |
[13] | 595 | ||||||||||||||||
| Aug12 |
595 | |||||||||||||||||
| Sep12 |
595 | |||||||||||||||||
| Oct12 |
[13] | 595 | ||||||||||||||||
| Nov12 |
595 | |||||||||||||||||
| Dec12 |
595 | |||||||||||||||||
| 2012 [12] |
968 279 |
1874 802 |
3187 923 |
8381 1989 |
6016 3151 |
595 | |
35% |
20426 7144 |
|||||||||
| Jan13 |
[13] | 627 | ||||||||||||||||
| Feb13 |
[13] | 627 | ||||||||||||||||
| Mar13 |
[13] | 627 | ||||||||||||||||
| Apr13 |
[13] | 627 | ||||||||||||||||
| May13 |
[13] | 627 | ||||||||||||||||
| Jun13 |
[13] | 627 | ||||||||||||||||
| Jul13 |
[15] |
627 | ||||||||||||||||
| Aug13 |
[15] | 627 | ||||||||||||||||
| Sep13 |
[15] | 627 | ||||||||||||||||
| Oct13 |
[15] | 627 | ||||||||||||||||
| Nov13 |
[15] | 627 | ||||||||||||||||
| Dec13 |
[15] | 627 | ||||||||||||||||
| 2013 [12] |
1077 304 |
2108 930 |
3482 917 |
9196 2160 |
0 0 |
6634 3207 |
627 | 33% |
22497 7518 |
5709 5176 |
||||||||
| Jan14 |
[15] | 632 | ||||||||||||||||
| Feb14 |
[15] | 632 | ||||||||||||||||
| Mar14 |
[15] | 632 | ||||||||||||||||
| Apr14 |
[15] | 632 | ||||||||||||||||
| May14 |
[15] | 632 | ||||||||||||||||
| Jun14 |
[15] | 632 | ||||||||||||||||
| Jul14 |
[15] | 632 | ||||||||||||||||
| Aug14 |
632 | |||||||||||||||||
| Sep14 |
632 | |||||||||||||||||
| Oct14 |
632 | |||||||||||||||||
| Nov14 |
632 | |||||||||||||||||
| Dec14 |
632 | |||||||||||||||||
| 2014 [12] |
1065 335 |
3561 1341 |
3854 1040 |
10527 2680 |
0 0 |
4900 2188 |
632 | 32% |
23907 7584 |
5606 5047 |
||||||||
| Jan15 [19] |
777 338 |
1279 |
||||||||||||||||
| Feb15 [19] |
2842 764 |
1279 |
||||||||||||||||
| Mar15 [19] |
3226 1253 |
1279 |
||||||||||||||||
| Jan15-Mar15 [8] |
74 26 |
619 276 |
1295 246 |
3487 1027 |
0 0 |
6552 2261 |
12027 3836 |
|||||||||||
| Apr15 [19] |
3487 982 |
992 |
||||||||||||||||
| May15 [19] |
585 182 |
992 |
||||||||||||||||
| Jun15 [19] |
513 232 |
992 |
||||||||||||||||
| Apr15-Jun15 [8] |
199 70 |
586 249 |
1455 382 |
3693 917 |
4510 1358 |
10443 2976 |
||||||||||||
| Jul15 |
883 |
|||||||||||||||||
| Aug15 |
883 |
|||||||||||||||||
| Sep15 |
883 |
|||||||||||||||||
| Jul15-Sep15 [8] |
292 98 |
745 356 |
1466 426 |
3392 981 |
1699 788 |
7594 2649 |
||||||||||||
| Oct15 |
970 |
|||||||||||||||||
| Nov15 |
970 |
|||||||||||||||||
| Dec15 |
970 |
|||||||||||||||||
| Oct15-Dec15 [8] |
249 114 |
864 383 |
1223 391 |
2813 722 |
1921 1299 |
7070 2909 |
||||||||||||
| 2015 [2] |
814 308 |
2814 1264 |
5439 1445 |
13385 3647 |
14682 5706 |
1031 |
33% |
37134 12370 |
8233 7783 |
|||||||||
| 2015 vs. 2014 |
261% |
163% |
||||||||||||||||
| 2015 vs. 2013 |
178% |
165% |
||||||||||||||||
| 2015 vs. 2012 |
181% |
173% |
||||||||||||||||
| Jan16 |
943 |
|||||||||||||||||
| Feb16 |
943 |
|||||||||||||||||
| Mar16 |
943 |
|||||||||||||||||
| Jan16-Mar16 [8] |
305 126 |
597 296 |
1113 377 |
3279 823 |
1773 1208 |
40% |
7067 2830 |
|||||||||||
| Apr16 |
1028 |
|||||||||||||||||
| May16 |
1028 |
|||||||||||||||||
| Jun16 |
1028 |
|||||||||||||||||
| Apr16-Jun16 [8] [20] |
378 132 |
759 357 |
1533 431 |
3783 905 |
2303 1259 |
8756 3085 |
||||||||||||
| Jul16 |
967 |
|||||||||||||||||
| Aug16 |
967 |
|||||||||||||||||
| Sep16 |
967 |
|||||||||||||||||
| Jul16-Sep16 [8] |
322 96 |
1041 432 |
1615 460 |
3648 871 |
2060 1043 |
8686 2902 |
||||||||||||
| Oct16 |
1206 |
|||||||||||||||||
| Nov16 |
1206 |
|||||||||||||||||
| Dec16 |
1206 |
|||||||||||||||||
| Oct16-Dec16 [8] |
352 140 |
1184 646 |
1540 482 |
3799 927 |
2162 1424 |
40% |
9037 3619 |
|||||||||||
| 2016 [2] |
1357 494 |
3581 1731 |
5801 1750 |
14509 3526 |
8298 4934 |
1036 |
37% |
33546 12436 |
7621 6801 |
|||||||||
| Jan17 |
1191 |
|||||||||||||||||
| Feb17 |
1191 |
|||||||||||||||||
| Mar17 |
1191 |
|||||||||||||||||
| Jan17-Mar17 [8] |
439 184 |
1119 593 |
1421 495 |
3689 839 |
2179 1463 |
8847 3574 |
||||||||||||
| Apr17 |
1183 |
|||||||||||||||||
| May17 |
1183 |
|||||||||||||||||
| Jun17 |
1183 |
|||||||||||||||||
| Apr17-Jun17 [8] |
512 147 |
1135 590 |
1889 606 |
3953 908 |
2387 1298 |
9876 3549 |
||||||||||||
| Jul17 |
1112 |
|||||||||||||||||
| Aug17 |
1112 |
|||||||||||||||||
| Sep17 |
1112 |
|||||||||||||||||
| Jul17-Sep17 [8] |
557 136 |
1187 605 |
1955 547 |
4595 863 |
2537 1184 |
10831 3335 |
||||||||||||
| Oct17 |
1325 |
|||||||||||||||||
| Nov17 |
1325 |
|||||||||||||||||
| Dec17 |
1325 |
|||||||||||||||||
| Oct17-Dec17 [8] |
567 210 |
1328 732 |
1530 498 |
3953 913 |
2591 1622 |
9969 3975 |
||||||||||||
| 2017 [2] |
2075 677 |
4769 2520 |
6795 2146 |
16190 3523 |
9694 5567 |
1203 |
37% |
39523 14433 |
10163 9010 |
|||||||||
| Jan18 |
1111 |
|||||||||||||||||
| Feb18 |
1111 |
|||||||||||||||||
| Mar18 |
1111 |
|||||||||||||||||
| Jan18-Mar18 [8] |
488 218 |
1234 662 |
1494 462 |
3633 836 |
1823 1155 |
38% |
8672 3333 |
|||||||||||
| Apr18 |
1084 |
|||||||||||||||||
| May18 |
1084 |
|||||||||||||||||
| Jun18 |
1084 |
|||||||||||||||||
| Apr18-Jun18 [8] |
459 140 |
1459 654 |
1909 578 |
3608 743 |
2410 1138 |
33% |
9845 3253 |
|||||||||||
| Jul18 |
1181 |
|||||||||||||||||
| Aug18 |
1181 |
|||||||||||||||||
| Sep18 |
1181 |
|||||||||||||||||
| Jul18-Sep18 [8] |
393 144 |
1421 679 |
1932 572 |
3813 847 |
2705 1301 |
35% |
10264 3543 |
|||||||||||
| Oct18 |
1366 |
|||||||||||||||||
| Nov18 |
1366 |
|||||||||||||||||
| Dec18 |
1366 |
|||||||||||||||||
| Oct18-Dec18 [8] |
426 157 |
1337 701 |
1680 589 |
3525 880 |
2634 1771 |
43% |
9602 4098 |
|||||||||||
| 2018 [2] |
1766 659 |
5451 2696 |
7015 2201 |
14579 3306 |
9572 5365 |
1185 |
37% |
38383 14227 |
||||||||||
| Jan19 |
1218 |
|||||||||||||||||
| Feb19 |
1218 |
|||||||||||||||||
| Mar19 |
1218 |
|||||||||||||||||
| Jan19-Mar19 [8] |
432 152 |
1145 581 |
1578 544 |
3547 856 |
2307 1521 |
41% |
9009 3654 |
|||||||||||
| Apr19 |
1171 |
|||||||||||||||||
| May19 |
1171 |
|||||||||||||||||
| Jun19 |
1171 |
|||||||||||||||||
| Apr19-Jun19 [8] |
435 93 |
1360 581 |
1920 611 |
3572 909 |
2540 1320 |
36% |
9827 3514 |
|||||||||||
| Jul19 |
1085 |
|||||||||||||||||
| Aug19 |
1085 |
|||||||||||||||||
| Sep19 |
1085 |
|||||||||||||||||
| Jul19-Sep19 [8] |
423 93 |
1237 503 |
1864 589 |
3327 912 |
2415 1158 |
35% |
9266 3255 |
|||||||||||
| Oct19 |
||||||||||||||||||
| Nov19 |
||||||||||||||||||
| Dec19 |
||||||||||||||||||
| Oct19-Dec19 |
||||||||||||||||||
| 2019 [2] (proj.) |
1720 451 |
4988 2219 |
7148 2325 |
13925 3568 |
9680 5330 |
1158 |
37% |
37460 13894 |
||||||||||
| Cam # |
14DA 01 |
14FA 01 |
HAWA 01 |
HAWA 03 |
LEWA 01 |
MATE 01 |
|
|
|
|||||||||
| [10] |
E. 14th NWbd @ Davis/ Callan [4] [17] |
Fair- mont NEbd @ E. 14th [4] [17] |
Halcyon Wbd @ Wash- ington [6] [4] [17] |
Floresta Ebd @ Wash- ington [6] [4] [17] |
Lewel- ling Ebd @ Wash- ington [4] [17] |
Marina Ebd @ Tea- garden [4] [17] |
avg tickets per month |
avg tickets per month |
Total Notices Printed as % of Violations Recorded [4] |
Total Violations Recorded/ Notices Printed Per Official Monthly CMR Reports [1] [4] |
Total Citations Issued/ Rolling Right Citations Per CVC 21455.5(i) Annual Reports [14] |
|||||||
This table made by highwayrobbery.net, using official reports provided by the City under the California Public Records Act.
Official report, Apr. 1 - Jun. 30, 2010
Official report, Dec. 2010
Official report, Mar. 2011
Official reports, Jan. 2011 - Feb. 2011 and Apr. 2011 - Oct. 2011
Official reports, Jan. 2006 - Oct. 2012
Official report, 2012, full year
Official report, 2013, full year
Official report, 2014, full year
Official report, early 2015 [16]
Official reports, Jan. 2015 - June 2015, MATE only [19]
Official reports, 2015 quarters
Official report, 1st Qtr 2016
Official report, 2nd Qtr 2016
Official report, 3rd Qtr 2016
Official report, 4th Qtr 2016
Official report, 1st Qtr 2017
Official report, 2nd Qtr 2017
Official report, 3rd Qtr 2017
Official reports, 4th Qtr 2017 and 1st Qtr 2018
Official report, 2nd Qtr 2018
Official report, 3rd Qtr 2018
Official report, 4th Qtr 2018
Official report, 1st Qtr 2019
Official report, 2nd Qtr 2019
Official report, 3rd Qtr 2019
[ ] indicates a footnote.
[1] Totals are as provided by the City.
[2] This annual total, or annual projection, is by highwayrobbery.net.
[3] Un-used columns are to allow for later expansion of City's system.
[4] Except where noted otherwise, the figures given in the table are for the single calendar month indicated. Any figures in red type (or, if you are looking at this table in black and white, the upper figure when there are two or more figures in a cell) are what RedFlex calls Total Violations, or all incidents recorded by the cameras, and due to time limitations may have been posted here only for selected months or locations. If there is sufficient public interest, the remaining months will be posted. The figures in black type are what RedFlex calls Notices Printed, and represent the sum of genuine citations issued (those filed with the court) plus any Nominations mailed (not filed with the court, a.k.a. Snitch Tickets).
[5] Calendar month data was requested on 9-18-10 but has not yet been received.
[6] The camera enforcement is believed to be on traffic on the first-named street, but the direction of enforcement (east, or west) has not yet been confirmed.
[7] Includes enforcement of posted "no turn on red" signs.
[8] From official report posted on the SLPD Traffic Division website - for a link to the Division's site see Docs Set # 4, below.
[10] The title bar has been repeated solely for the convenience of the reader - there is no difference between it and the one at the top of the table.
[12] These figures are from reports covering the full year, which were posted on the City's website. The City posted the report for 2012 in Feb. 2013, they posted the report for 2013 in Aug. 2014, and they posted the report for 2014 in Feb 2015.
[13] Calendar month data was requested on 6-2-13 and again on 7-29-14 but as of 2-17-15 had not been received.
[14] These figures are from the annual reports RedFlex filed with the Judicial Council of California, in which the company provided figures for the number of right turn tickets - see Set # 2, below. These annual reports are usually filed about nine months after the end of the calendar year.
[15] Calendar month data was requested 7-29-14 but as of 2-17-15 had not been received.
[16] The report for this period, which the SLPD posted on its website - was generated on April 29, the same day the SLPD selected to be the end of the reporting period, so not all of the violations which had occurred by April 29 would have been processed or approved (the report shows 1426 "in progress"), and more violations were likely to occur in the remaining day and a half of the four months.
[17] The 2005 Dowling Study which listed the City's most dangerous intersections (see link in Set # 3, below) did not include any of these intersections where the cameras eventually were installed.
[18] Unused
[19] The early 2015 monthly reports for MATE-01 were provided by an organization which (legally) obtained them from the SLPD. The reports were not posted on the SLPD website.
[20] These reports were generated less than ten days after the last day of the report period. To adjust for violations photographed but not yet processed and ticketed ("In Progress"), the Approved Violations figures found on the reports were increased by 0.344 of the In Progress violations. ( 0.344 is the ratio of Notices Printed to Total Violations Recorded, during 2015 and the first quarter of 2016.)
A LOT of Right Turn Tickets - at the Wrong Intersections
The "Late Time"graphs, part of Redflex' standard statistical package, track violations recorded (not tickets issued).
Where there is a large number of long Late Time violations in a curb lane, it is believed to indicate heavy ticketing on right turns.
(The curb lane will be the lane with the highest lane number.)
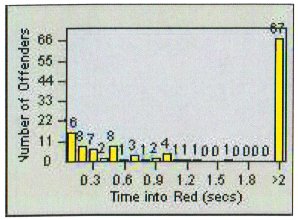
The picture above is an example from another city.
These graphs are available for more than fifty California cities
- see the list in the expanded version of Defect # 9.
Until 2017, San Leandro would not provide these graphs or provide a copy of the database so that we could construct our own version of the graph.
However, an annual report RedFlex filed with the Judicial Council of California provided figures for the number of right turn tickets. The figures show that in 2014 90% of San Leandro's tickets were for right turns.
It is also interesting to note that the 2005 Dowling Study which examined the City's most dangerous intersections (see link in Set # 3, below) did not include any of the intersections where the cameras eventually were installed.
(Also read the engineering study linked in Set # 5, below.)
2016 - 2017 (12 Months)
San
Leandro Docs Set # 3
The Contract -
Paying WAY Too Much, and How Much They Make
2005
Dowling Study of the Most Dangerous Intersections
2005
Staff Report and Minutes
2005
Contract
2011
Contract
(signed)
2011 Staff
Report
2011 Minutes
The early 2005 Dowling Study listed the City's most dangerous intersections, but did not include any of the intersections where the cameras eventually were installed.
On Sept. 6, 2005 the
city council gave preliminary approval to a contract with
RedFlex, for cameras at five intersections. The contract
included an illegal "cost neutrality" clause, whereby the
city would not have to pay RedFlex
the full rent if fine revenue was insufficient to
cover the rent. See Subsection B. of Defect # 10.
The staff report prepared for the Sept. 6 council meeting
also contained this remarkable statement:
"Conclusion.
Although San Leandro has not yet experienced a serious
problem with traffic collisions directly related
to red light violations, the city is continuing to
experience an increase in the overall amount of traffic
flow throughout the community."
2011: New Contract
With a contract
renewal looming, on Apr. 5 and 18, 2011 highwayrobbery.net
wrote to the city council, suggesting that they negotiate
for a better price.
On Apr. 18, 2011 the
city council heard public comments from four San Leandro
residents who questioned the use of the cameras and none
who supported the cameras (see Staff Report and Minutes,
above), then voted 4 - 3 (ayes: Prola, Starosciak,
Reed, Souza; nays: Cassidy, Cutter, Gregory) to accept a
new 8-year contact under which the City will pay $5200
monthly rent per camera for five of the six existing
cameras. One camera is to be removed. Cost
neutrality was replaced by "financial feasibility," but
there can be no review of those numbers until June 2015 -
see Section 7.2 of the new contract.
They agreed to pay
way too much.
Looking at it from the motorist's perspective, the City will need to issue an extra 10,560 tickets to cover the extra rent (assuming that 2/3 of those ticketed pay their tickets and that the City's portion of the approx. $500 fine is $150, netting the City $100 per ticket issued.)
There is another problem with the new contract. It contains no escape clause (Termination for Convenience) should a future city council wish to terminate the contract, or if the voters terminate the contract via initiative. A complete contract will include a formula by which the cost of such a "Termination for Convenience" is to be calculated. For an example of such a formula, see Section 6.2 in Victorville's original contract (available on the Victorville Documents page).
2014: Prices Soften Even More
In early 2014 the City of Elk Grove negotiated the following prices for its five RedFlex cameras.
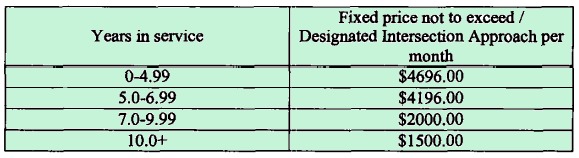
From Exh. D of the March 2014 Elk
Grove Contract
2015: City Misses First Opportunity to
Renegotiate!
Per Section 7.2 of the 2011 contract, June 2015 was the
first opportunity for the City to renegotiate the
rent. But there is no record of the City
considering, or doing, a renegotiation at that time.
The only record highwayrobbery.net has been able to obtain
is the following table created by Finance Department staff
on or before July 26, 2017 - which shows no reduction in
the payment to RedFlex.

This list of contracts and amendments was up-to-date as
of 7-26-17.
San Leandro Docs Set # 4
Info
at PD Site
The police department's red light camera web page
has extensive materials about the program - including
business rules, guidelines and official reports showing
the number of tickets issued. Beginning in 2015
they increased the frequency of those reports to
quarterly.
If the link above ceases to work, try
drilling down:
Departments > Police > Divisions > Traffic >
Red Light Cameras
San Leandro Docs Set # 5
Encroachment
Permits:
2016 Engineering Study Shows Camera Intersections
Improved Less Than Non-Camera Intersections
Some of the City's cameras are located on CalTrans
right-of-ways, so are operated under an encroachment
permit obtained from CalTrans. HighwayRobbery.net
obtained these documents from CalTrans, via a public
records request.
Permit
Application 2005, Issued 2006
In 2016, as part of its application to
CalTrans for re-issuance of its annual encroachment
permit, the City commissioned a study
by an independent engineering firm. From the
study, pages 6 and 10:
"After reviewing over 13 years of
collision data for the two intersections, our findings
are
inconclusive with regards to an ARLE [red light camera]
reducing collisions."
"For whatever reason, it appears that
the injury plus fatality collision rate at signalized
intersections (with or without ARLE) has decreased
dramatically over the most recent nine year period (when
compared to the previous nine year period). ARLE
cannot take credit for this reduction,
because the collision rate decreased more at signalized
intersections without ARLE."
Some other cities operate cameras under encroachment
permits. For more information about those cities
and about CalTrans' criteria for the issuance of an
encroachment permit, see the CalTrans section on the
Links page.
San Leandro Docs Set # 6
More
Coming
There may be some more San Leandro
information posted in the next few weeks. Mark
your calendar to remind you to come back here and
look!
---------------------------------
RED LIGHT
CAMERAS
www.highwayrobbery.net
www.highwayrobbery.net