If you haven't already done so, please read the Home page
Back to Culver
City Documents Main page
This Page is Culver City Documents -
Set # 2
Automated Enforcement Program Financials
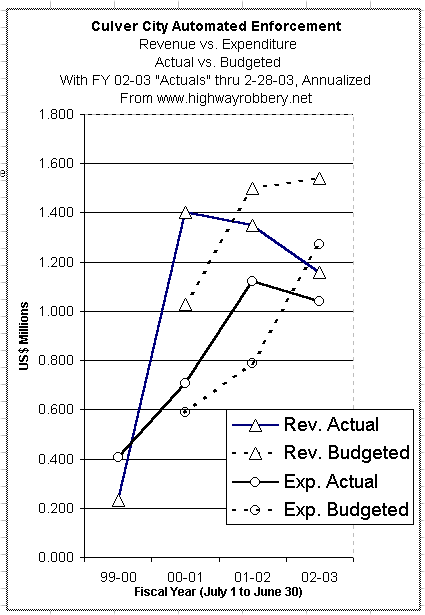
The graph below is a Feb. 21, 2003 update of a graph the editor of this site prepared and presented at an October 2002 Culver City Council meeting. It shows:
(a) that in the first full fiscal year (00-01) of operation the City almost doubled its money - the profit margin for the automated enforcement program was 49%;
(b) in the next (and most recent) full fiscal year (01-02), revenue flattened out, actually dropping somewhat, expenditure ran 42% higher than the amount budgeted, and the profit margin dropped to 17%;
(c) and (New 3-15-03) that if the program's performance (revenue 25% below the budgeted rate) during the first eight months of the current fiscal year (02-03) continues for the remainder of the year, the profit flowing from the program to the City's General Fund will be 57% less than the City expects. See the graph, below.

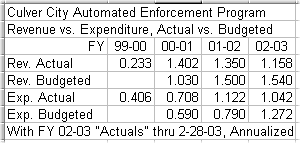
The following table contains the figures, assembled by the editor of this website, from which the graph above was constructed.

The
Monthly Revenue, 2010 to Present
The City's monthly ticket revenue from the court is
available in the Revenue Spreadsheet on the LA County
Docs page, which is the source of this graph.

Back to
Top of Culver City Documents - Set #2
--------------------------------
RED LIGHT CAMERAS
www.highwayrobbery.net
www.highwayrobbery.net