If you haven't already done so, please read the Home Page
This Page is Culver
City Documents - Set # 5
New
2-26-03,
partially updated 6-13-04:
Map of
Culver City's
Camera
Locations
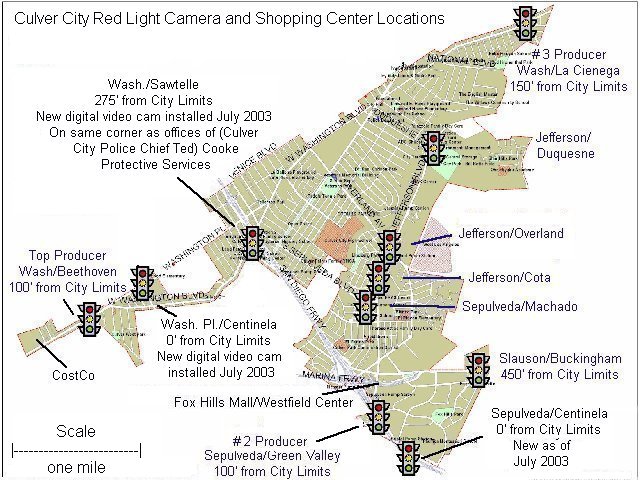
This map shows the location of eleven cameras, including three that were installed in July 2003.

Map prepared by highwayrobbery.net
June 2004 updates to the
map:
Chief Cooke retired in Nov. 2003.
The new and very productive cameras at
Jefferson/Overland (left turns)
and Washington/Sawtelle are now in a 3-way tie with
Sepulveda/Green
Valley, for #2 Producer. Washington/Beethoven
retains the top
position.
About
that
Tentacle,
Sir!
- A Note from the Neighbors
(From
the
newsletter
of
a neighborhood association in a nearby city)
"In a
boundary worthy of a dubious congressional
district, Culver City includes a narrow strip of
land that extends west
along Washington Blvd. from Sepulveda to
Lincoln. In many places
this strip is no wider than 100 feet. But it
allows Culver City
to benefit from the tax revenues of, among other
things, the Costco
complex."
"It also
allows Culver City to benefit, at the expense
of mostly non-Culver City residents, from two red
light cams, both on
Washington, one at Beethoven, and now a second one
at Centinela."
"But
aside from the questionable justice of this brand
of law-enforcement,
aside from the exorbitant cost of the fine, is it
fair that Culver City
should be allowed to milk so many non-residents
along its
revenue-su#king tentacle?"
New
3-28-03,
updated 9-9-03:
A Possible Explanation Why Just
a Few
Locations Produce Most of the Revenue
"To avoid the risk of
legal
challenges, local governments should petition Caltrans
to clarify its
traffic manual to explain when local governments
should use either
posted speeds or the results from speed surveys to
establish yellow
light time intervals at intersections equipped with
red light cameras."
(Recommendation, California State Auditor's
report, page
46. See Links Page.)
On Mar. 27 and 28, 2003 I had a chance to review the
speed
surveys
that the City used to determine what speed limits would
be posted on
the
streets where camera enforcement is used. These surveys
revealed a
close
match between high ticket production and, at those same
locations,
Posted Speed Limits substantially below the 85th
Percentile*
Speed (thereby allowing the City to set a shorter yellow
time).
*For an explanation of 85th Percentile Speed, see Defect
# 2 on the Home
Page.
Examples:
Washington / Beethoven, by far the top revenue producer, has 85th Percentile Speeds of 38 eastbound, and 45 westbound, averaging 6.5 mph greater than the posted speed of 35 mph. (Late note: On Aug. 25, 2003 the city council adopted a new speed survey which changed both of those 85th percentile speeds to 38. The effective date of that change was Sept. 24. For more about this change, see the expanded version of Defect # 2.)
Sepulveda / Green Valley, the #2 revenue producer, has 85th Percentile Speeds of 41 in both directions, 6 mph greater than the posted speed of 35 mph. (Late note: On August 25, 2003 the city council adopted a new speed survey which changes those 85th percentile speeds to 37 and 38. The effective date of that change was Sept. 24.)
Washington / La Cienega, the #3 revenue producer, has 85th Percentile Speeds (on La Cienega) of 41 southbound, and 39 northbound, averaging 5 mph greater than the posted speed of 35 mph. (Late note: On August 25, 2003 the city council adopted a new speed survey which changes those 85th percentile speeds to 36 and 37. The effective date of that change was Sept. 24.)
Slauson / Buckingham, one of the lowest producers, has 85th Percentile Speeds of 46 eastbound, and 48 westbound, averaging 2 mph greater than the posted speed of 45 mph. (Late note: On August 25, 2003 the city council adopted a new speed survey which changes those 85th percentile speeds to 44 and 48 and lowered the speed limit to 40. The effective date of that change was Sept. 24.)
Sepulveda / Machado, a low producer, has 85th Percentile Speeds of 43 southbound, and 40 northbound, averaging 1.5 mph greater than the posted speed of 40 mph. (Late note: On August 25, 2003 the city council adopted a new speed survey which changes both of those 85th percentile speeds to 43. The effective date of that change was Sept. 24.)
Jefferson / Duquesne, one of the very lowest producers, is the boundary between two survey zones, and has 85th Percentile Speeds of 41 (leading in to the intersection) and 38 (after the intersection) southbound, and 40 (leading in) and 41 (after) northbound, averaging the same as the posted speed of 40 mph. (Late note: On August 25, 2003 the city council adopted a new speed survey which changes those 85th percentile speeds to 44, 44, 45 and 45, respectively. The effective date of that change was Sept. 24.)
Jefferson / Cota, a low producer, is the boundary between two survey zones, and has 85th Percentile Speeds of 33 (leading in to the intersection) and 34 (after the intersection) southbound, and 35 (leading in) and 31 (after) northbound, averaging 1.75 mph less than the posted speed of 35 mph. (Late note: On August 25, 2003 the city council adopted a new speed survey which combines those two survey zones and changes those 85th percentile speeds to 40 in both directions. The effective date of that change was Sept. 24.)
A Question
The
drafters of AB 1022 (see Action Page) say they followed
the
recommendations made by the state auditor. Why
didn't they follow
the
recommendation to resolve the posted speed vs. 85th
Percentile Speed
question?
---------------------------------
RED LIGHT
CAMERAS
www.highwayrobbery.net
www.highwayrobbery.net