Email
Address
Site
Index
Main
FAQ Section
FAQ # 6
Red Light Camera
Studies:
Alternatives to Cameras
(Engineering Countermeasures)
Updated 10-21-16

Question: Engineers who have studied red light
running - those who do not stand to gain financially
from the use of red light cameras - suggest that
cities try alternatives to
cameras (also known as engineering
countermeasures) before installing cameras. Why
is that, and what are the alternatives?
Part (A) of Answer: Why is that?
Every city has one or more traffic engineers working for it, and they read the literature about the countermeasures against running, so you'd think that it would not be necessary for outsiders to intervene and press for countermeasures to be installed. Yet it is.
It could be about money. Some countermeasures cost money to install and maintain, while cameras are installed "for free," and can make money. Here is acknowledgment of the Industry's concern that at intersections with countermeasures, there will not be enough violations to make the system pay.
After traffic engineers in the City of Oakland added one second to their yellows, the resulting drop in ticket revenue sparked a four-month battle between the engineers and the police. Unfortunately, the engineers (and the public) lost, and the yellows were shortened.
Internal documents from the City of San Diego showed numerous intersections rejected as camera sites, with the notation, "long yellow - vio(lation) volume not there."
Or it could be the novelty of the cameras. Police like to have all the latest technology, and city councilmembers, not wanting to be depicted as "soft on crime," are reluctant to deny any request made by their police force.
If you want to find out if your city studied or applied countermeasures at the intersection where you were ticketed, ask them about it, via a public records request. Or, you could ask the city council to stencil "signal ahead" on the pavement near their top ten most dangerous intersections, and see how they react.
Part (B) of Answer: What are the Alternatives?
1. One alternative is to lengthen the yellow light, which is known to dramatically reduce the number of cars running the lights. One study - details below - showed a 69% decrease in violations when a yellow was increased from 4.0 seconds, to 4.5 seconds. Other studies - details below - gave similar results, and also rated engineering countermeasures such as longer yellows "most effective" in reducing unintentional running while enforcement, including cameras, was considered "less effective."
(To see the formal efforts underway to require longer yellows, read the Expanded version of Defect # 2.)
Follow-up Question # 1: What about "rebound?" Won't drivers get used to the longer yellows, and resume running the light?
Answer to Follow-up # 1: No, drivers do not adjust, and the violations stay down, do not rebound. Numerous sources confirm that. Here are some -
http://scholar.lib.vt.edu/theses/available/etd-06242004-230619/unrestricted/Thesis_3.pdf, at page 67
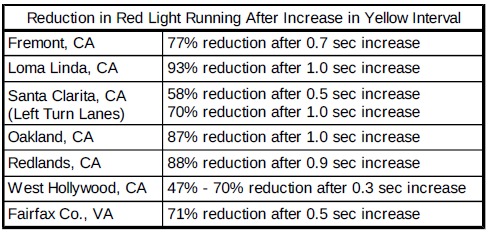
c. More examples of no rebound after an increase in the length of the yellow:
Redlandsd. Consider this discussion, by traffic engineers, in the Electronic National Dialog on Transportation Operations, and the study they cited:
Mission/Mojave in Fremont
Willow/Bayfront in Menlo Park
Loma Linda
SaferStreetsLA's Compendium
Table from SaferStreetsLA.org Compendium
"Research has consistently shown that drivers do not, in fact, adapt to the length of the yellow." [Determining Vehicle Change Intervals - A Proposed Recommended Practice", ITE, 1985]
"Olson and Rothery reported in 1972 that their research showed that drivers were 'virtually' certain to stop if their required deceleration rate was less than 8 feet per second squared [ 0.25 G ] and virtually certain to continue if the deceleration rate required was in excess of 12 feet per second squared [ 0.38 G ]." [Determining Vehicle Change Intervals - A Proposed Recommended Practice", ITE, 1985]
Follow-up Question # 2: In my town, ticketing stayed down for a year or two after they lengthened some of the yellows, but now ticketing is coming back up. Why?
Answer to Follow-up # 2: If you inquire with the police, often they will claim that the rise in ticketing was due to the improving economy. But the actual cause may have been some changes the police and/or the camera company made to the camera system. If you look at the monthly intersection-by-intersection ticket counts and see a sudden rise, or a rise at just a few intersections, or a rise in just one town in a region having many towns with cameras, that would be consistent with manipulation of the camera system. A gradual rise at most or all intersections, or most cities in a region, would be consistent with economic improvement.
Follow-up Question # 3: OK, running goes down (and stays down, no rebound) when you lengthen the yellow, but do accidents also go down?
Answer to Follow-up # 3: Lengthening the yellow also reduces severe accidents. One source is a 2004 study by the Texas Transportation Institute (TTI) which found (at page 2-20, see graph below), "…an increase in the yellow duration of 1.0 second is associated with an MF [crash frequency] of about 0.6, which corresponds to a 40 percent reduction in crashes."
Another source is more from the Electronic National Dialog: "The average implied deceleration rate of the group with the highest crash rate was slightly over 13 feet per second squared [ 0.41 G ], and the deceleration rate for the group with the lowest crash rate was 8.5 feet per second squared [ 0.27 G ]." ["Effect of Clearance Interval Timing on Traffic Flow and Crashes at Signalized Intersections," Zador/Stein/Shapiro/Tarnoff, ITE Journal, November 1985]
2. Another alternative is to improve street markings and the other cues that warn motorists they are coming to a signal.
Anyone who watches the crash videos circulated by the Industry will notice that most of the crashes occur many seconds into the red. In 2004 the Texas Transportation Institute (TTI), with sponsorship by the Texas DOT, studied 41 crash videos obtained from red light cameras and confirmed what the public was noticing: "With one exception, all of the right-angle crashes occurred after 5 seconds or more of red." They also reported that the average was 8.9 seconds into the red. (Link to the study: http://thenewspaper.com/rlc/docs/04-alternatives.pdf See pages 5-15 and 5-16.)
Those real late runners (5+ secs. late) aren't doing it on purpose. Recent evidence (FAQ # 22) is that the majority of violators don't live in town, so they simply don't know that there's a signal up ahead. They are lost or distracted, and by the time they notice that the signal is there, it is too late to stop.
A minority of the violations are by "locals" who forgot about the camera up ahead because they were distracted, or impaired.
Because they won't know or won't remember there's a camera up ahead, the presence of a camera won't keep the visitors or the distracted/impaired locals from making the real late runs. To cut these real late runs, a city should install visual cues to make its most dangerous intersections more prominent and to warn motorists, "signal ahead." Most of these engineering countermeasures are cheap and quick to do. Examples:
2005 research sponsored by the Florida Department of Transportation concluded that improving street markings (painting "signal ahead" on the pavement) near intersections would reduce red light running by up to 74 percent. (http://thenewspaper.com/rlc/docs/05-simulator.pdf Section 3.4, p. 69 of the document, or p. 84 of the pdf.) A large red light camera study sponsored by the San Diego Police Department rated engineering countermeasures such as better markings as "most effective" in reducing unintentional running, while enforcement, including cameras, was considered "less effective." (http://www.highwayrobbery.net/redlightcamsdocsSanDiegoMain.html#SDdocs2 Table 6.3, p. 80 of the document, or p. 97 of the pdf.)
The 2004 TTI study (at page 5-9, link above) noted that countermeasures like increasing the diameter of signal lamps from 8" up to 12"or adding signal heads had the potential to decrease crashes by 47 percent. The 2005 Florida research recommended the installation of a signal pole on the "near" side of intersections. (The link is above. See p. 135 of the document, or p. 150 of the pdf.)
The 2004 TTI study (at page 5-9, link above) noted that adding backboards (back plates) to the signals had the potential to decrease crashes by 32 percent.
Highwayrobbery.net suggests putting up a large and lighted name sign for the cross street, and larger bulbs in the street lights, at dangerous intersections.
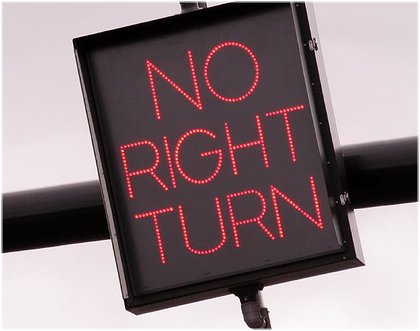
Highwayrobbery.net suggests that if the number and severity of accidents caused by rolling right turns on red is high and has not declined despite the application of photo enforcement, the city should study its records and videos to determine when during the red phase the accidents occurred and then install Blank Out signs programmed to light up and prohibit right turns during the high risk portion of the signal cycle. The Blank Out sign should display this universal "no right turn" symbol,
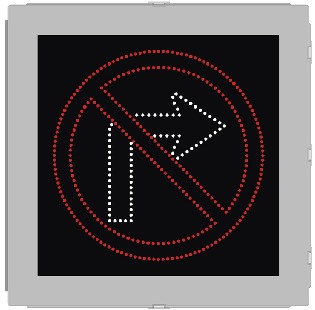
not the English words "no right turn."
Adding visual cues becomes even more important when the intersection is missing much of the urban junk - brightly lit gas stations, crossing overhead utility lines, commercial signage, bus benches - that helps to warn us that we are approaching a major intersection.
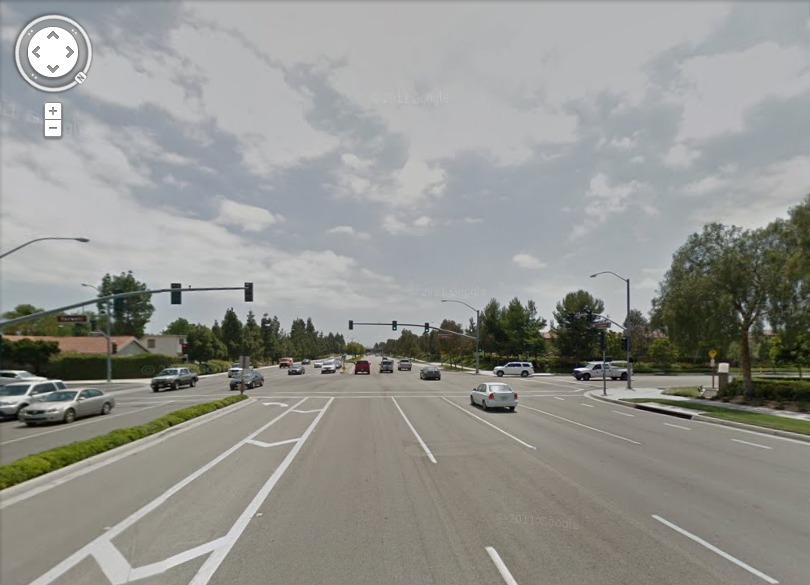
Culver at Farwell in Irvine, CA, site of Jan.
2011 fatal crash.
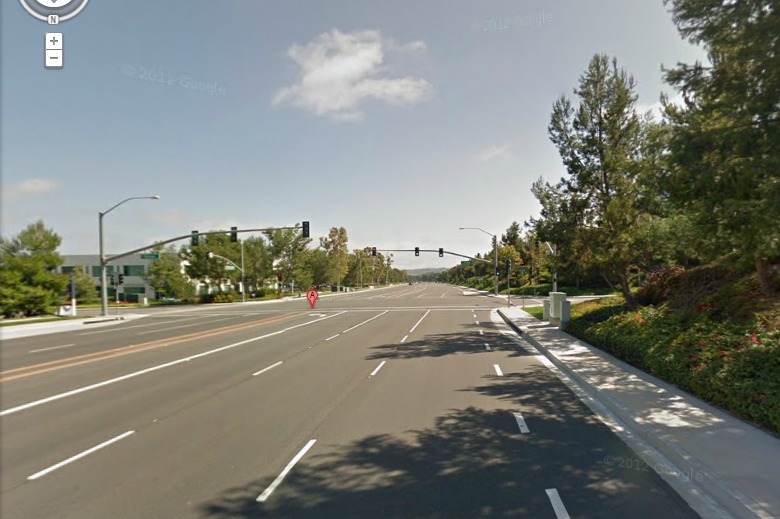
Aliso Viejo at Grand, Aliso Viejo, CA, site of
July 2012 five-car crash
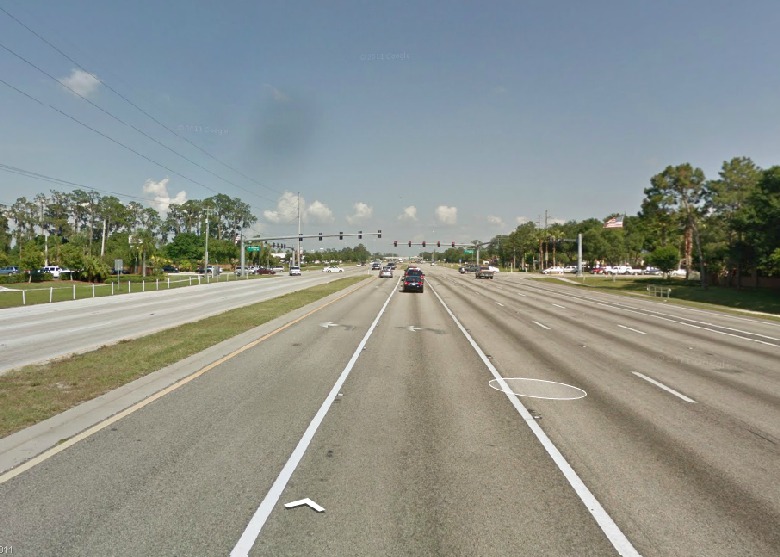
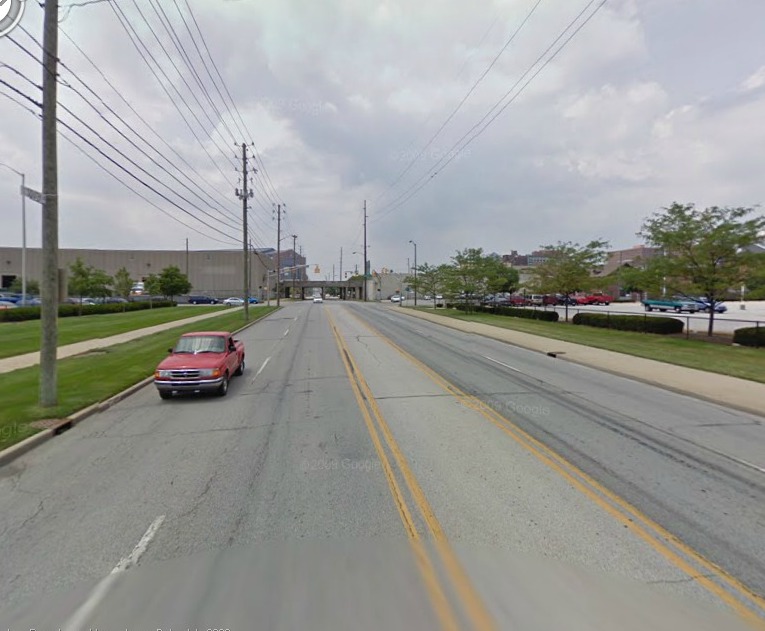
Rte. 70 looking East, 250' from intersection with
Tara Blvd., Bradenton, Florida, site of Oct. 2003
T-bone crash which killed Mark Wandall and led
to the passage of Florida's Mark Wandall Traffic
Safety Act of 2010. Wandall was a passenger in a
vehicle turning left from Westbound 70 onto Tara,
which was hit by a vehicle proceeding Eastbound on
Rte. 70.
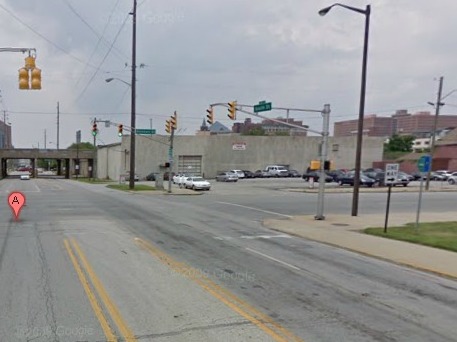
There's an intersection ahead? On South Street looking West, 200' from intersection with Delaware Street, site of T-bone crash which killed one and injured fourteen, on June 5, 2010, in Indianapolis. See close-up, below.
Missing limit line paint at South/Delaware, Indianapolis
There's no denying that the clean spare look at the intersections depicted above is attractive, but if you don't have the urban junk you need to add and maintain the other visual cues.
Providing visual cues is also important where there's too much urban junk competing for drivers' attention, as seen at the two intersections pictured below.

Impending crash at St. Georges/Stiles, Linden,
NJ, site of an ATS camera
White arrows point to signals (one of which is almost
lost in the background clutter), which are
yellow.
ATS published this photo as an example of an accident
caused by a straight-though
runner. But the Linden police found the driver
turning left, not the straight-thru driver, to be at
fault.
See discussion on the Industry
PR page.
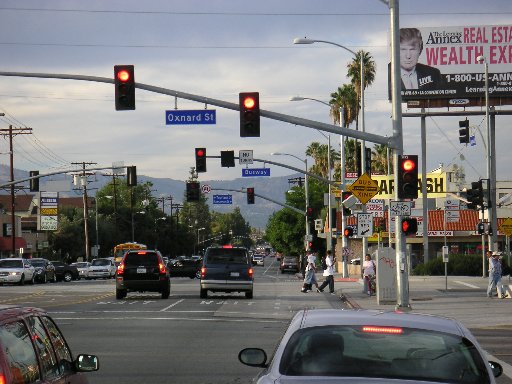
Reseda Blvd. crossing Oxnard Street, the
Orange Line Busway, a bike path, and Topham Street -
all in 200 feet, with three sets of signals - in Los
Angeles' San Fernando Valley. Site of a camera
operated by the Metro/MTA
Conclusion
Most people who
intentionally run signals do so by just a
small fraction of a second. On the other hand,
the accident
photos (captured by ticket cameras) the
Industry has posted on the 'net show, almost
exclusively, accidents which occurred multiple
seconds after the light turned red - accidents that
most likely were caused by unintentional
running. (Who would deliberately run a signal
by the ten or twenty seconds shown on many of the
Industry's photos?) The preponderance of
photos with long red times among the Industry's
crash photos argues that unintentional running is
more dangerous than intentional running.
Engineering countermeasures such as longer yellows
and better markings are more effective against
unintentional running than is enforcement.
Among the advantages of doing the alternatives above
(engineering countermeasures) are -
(1) A reduction
of red light running by ALL drivers, including
visitors to town and unintentional runners - not
just the "locals" who know that there are cameras
around.
(2) A statistically significant decrease in
the number of severe accidents, without the red
light camera side effect of increased rear-end
accidents. (For more about rear-enders, see
FAQ # 19.)
(3) These alternatives are cheap, so can be
done at all the dangerous intersections in town, not
just a few as with cameras.
(4) Fixing the problematic intersections -
rather than maintaining the status quo and making
money by taking pictures of the carnage - helps to
protect the city against negligence claims arising
from accidents.
RED LIGHT CAMERAS
www.highwayrobbery.net
www.highwayrobbery.net