If you haven't already done so, please read the Fremont section on the Camera Towns page
City of
Fremont Documents
(and Information)
Fremont, pop. 190,000, is in the East Bay, 10
miles north of San Jose and 25 miles southeast
of San Francisco.
Fremont is a RedFlex town. Many RedFlex towns send out "Snitch Tickets," which you can ignore. A Snitch Ticket will not have the Superior Court's name and address on it. For more details, see the Snitch Ticket section on the Your Ticket page.
June 16, 2020:
Council Approved Two More Cams on Automall and
Up-To-Seven-Year Extension (See Set # 6, Below)
If you have a Fremont red light camera ticket or
speeding ticket, please be sure to contact me, and
also be sure to look at the Countywide Information,
on the Oakland
Documents page.
Free Coffee!
| Coffee with the Cops travels
to Starbucks Coffee! Please join Police Chief Kimberly Petersen and members of the Fremont Police Department for coffee in an informal and friendly setting at the Starbucks Coffee on February 5, from 8:00 - 10:00 a.m. In addition to police commander personnel, staff from the Community Engagement Unit, Patrol and Investigations will be in attendance to answer public safety questions, discuss neighborhood concerns or just get acquainted. Coffee will be provided. Date: Wednesday, February 5, 2020 Time: 8:00 a.m. - 10:00 a.m. Location: Starbucks Coffee 41093 Fremont Blvd., Fremont No formal presentation is planned, so feel free to drop in anytime during the event. We hope to see you there! Contact
Information: |
East Bay Voters:
Do you live in the South end of Alameda County or the
North end of Santa Clara County - State Sen. Ellen
Corbett's former District?
In 2014 Sen. Corbett "termed out," and
was replaced by this person
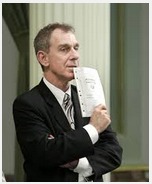
(Image 1)
Wieckowski, Author of the
anti-motorist bills SB
246, SB
1 and AB 666
In March 2020 please don't vote for
him for Supervisor.
Send him back home to his bankruptcy
law practice.
As of 2019 he still is in the State Legislature in
Sacramento and was the author of SB 246 of 2019 (had
it passed it would have added a 10% tax to each barrel
of oil).
He was co-author of SB 1 which raised gas tax
and car registration fees beginning Nov. 2017 and
which was the subject of an attempted repeal, by
Prop. 6 on the Nov. 2018 ballot.
In 2013 he was the author of AB-666 which - had it
passed - would have increased the number of red
light camera tickets.
Before reaching the Legislature he was a member of
the Fremont City Council, and during his time on the
council he approved two extensions of Fremont's
contract with RedFlex: He was the maker of the
2005 motion to extend the contract to 2010, and in
2010 he made the motion to extend the contract to
June 2017.
"According to City of Fremont
Staff, other safety features to improve safety and
discourage red light violations were not considered
prior to the installations of the ARLE systems [red
light cameras] at either study intersection. To
date, the City is satisfied with the operational
benefits of the current ARLE system and have not
explored other possible countermeasures."
From 2016 independent study commissioned by the City of
Fremont. See Set # 9, below.
Fremont Docs Set # 1
Is There a
Quota in Fremont? Is It Corrupt or Just
Inept? Refunds: Fractional
| "I believe that
Americans should be deeply skeptical of government
power." James Comey, Director of the FBI 2013 - 2017, on 60 Minutes, Oct. 12, 2014 |
New 2-5-17, updated 11-10-19
2015 - 2019:
Ticketing Way Down, Then Way Up, Then Way Down,
Then ...
Immediately after the new statewide
rule requiring longer yellows took effect on Aug. 1,
2015 (for more info about the new rule see Defect # 2 on
the Home page), Fremont's ticketing dropped to about
half of what it had been, and stayed low through
November 2015. Then in December 2015, ticketing
began to go back up and by February 2016 it had almost
doubled, with most of the sudden increase coming from
two cameras on Mowry. Ticketing by those two
cameras stayed high until November 2016, when it dropped
by 3/4.
Between Feb. and Oct. 2016, approx. 4000 extra tickets
were issued.
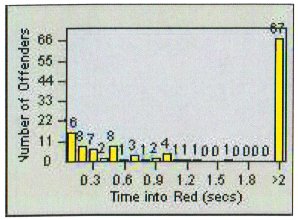
In Sept. 2019 ticketing was the highest
in three years and included spikes coming from the same
two cameras on Mowry.
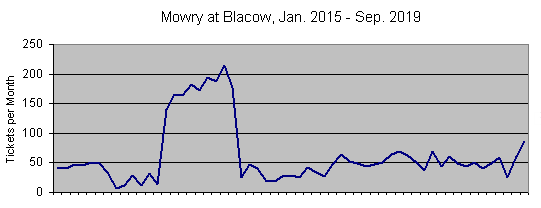
(Image 2, by
highwayrobbery.net)
See Table B in Set # 2, below, for detailed ticket
counts.
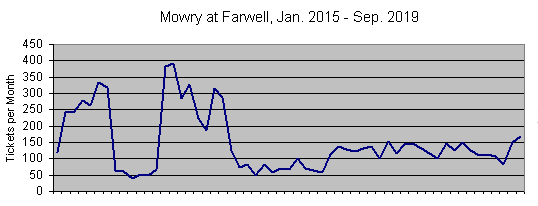
So, what happened on Mowry at Farwell and Blacow, in
2015 - 2016?
The wild oscillations in ticketing were
caused by multiple changes to the lengths of the
yellows, as shown in this timeline.
(Table 1, by highwayrobbery.net, updated 11-11-19)
|
Notes for Table 1
Note 1: Portions of the City's 2001 Engr. & Traffic Survey (ETS) were received in 2006, by postal mail from the City. The full 2001 ETS book (Part A Part B) was received in Mar. 2017 via email from the City Note 2: The City's 2008 Engr. & Traffic Survey (ETS) book was found on the City's website, by Google, in Dec. 2017. There is no direct link to it on the City's current website. (See pdf pages 97 and 98.) Note 3: The City's spreadsheet dated 8/18/15 was received on 4/25/16 via email from the City. Note 4: The City's signal timing charts dated 8/19/15 and 4/22/16 (30 MB file) were received on 4/25/16 via email from the City. (See pdf pages 70, 77, 78, 88, 89, 90 and 97 - 98.) The City's signal timing charts dated 2/21/17 were received on 2/24/17 via email from the City. The City's signal timing charts dated Aug. 2017 were received on 11/9/17 via email from the City. Note 5: The City's 2015 "Final" Engr. & Traffic Survey book (cover date 11/5/15, revision of 2/16/16) also is available on the City's website, at fremont.gov > departments > transportation engineering > transportation data. (See pdf pages 24 and 203 - 204.) Note 6: The 3/10/15 field survey sheet for Mowry, which was replaced by a survey sheet dated 9/24/15 prior to the 11/5/15 publication of the "Final" ETS book, was first obtained on 1/23/17, by KPIX. It was also found in the June 2015 Draft Engr. & Traffic Survey book, which was received on 2/24/17 via email from the City. Note 7: Statement by Public Works Director Hans Larsen, in Feb. 22, 2017 East Bay Times article. |
(Table
1 notes, by highwayrobbery.net)
In a Feb. 3, 2017 TV interview the
City denied that it had made any changes to the yellows
on Mowry.
| “We had student interns that were
helping us update the records,” said Hans Larsen,
Fremont’s public works director. “Unfortunately,
in a few cases, some of the information that was
on those pieces of paper wasn’t accurate and
doesn’t represent what was actually done out in
the field at the traffic signals,” said Larsen. He says even though it may look that way, the yellow lights were never actually shortened. People will hear that and say ‘oh really? Blame it on the intern?’ But Larsen insists: “What we are talking about is what is written on a piece of paper. I mean the issue here is, is the yellow timing out at the intersection in compliance with state laws? The answer is yes.” As for the spike in tickets over nine months last year Larsen says it’s partly more traffic but also what he describes as the “rebound effect.” From KPIX broadcast, 2-3-17. |
It was obvious to the public that the City's attempt to
blame "more traffic" or the "rebound effect" was
inconsistent with the suddenness of the Feb. 1, 2016
increase, and after a few weeks Public Works Director
Larsen admitted that the yellows had indeed been
shortened. (East Bay Times, 2-22-17.)
(For more info about rebound, see FAQ # 6.)
So, why did the City change the
yellows?
It all started when the City lengthened
the yellows to 4.7 seconds on Aug. 1, 2015, to meet the
deadline to comply with the new statewide rule requiring
longer yellows. City staff used the 85th% from the
field survey sheet from Mar. 2015; that 47.5 mph 85th%
required a 4.7 yellow.
That 47.5 mph 85th% presented the City
with two problems. The new 4.7
yellows cut ticket production by the two cameras to
1/4 of the previous rate and, had the
47.5 mph 85th% been allowed to remain in the records, it
would have forced an increase of the posted speed limit.
So someone - probably senior City staff - then hand
annotated a copy of the original survey in red (below) to show the
preferred end result.
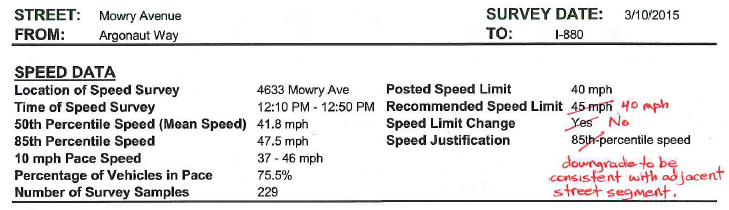
(Image 3, by highwayrobbery.net)
From the Mar. 2015 draft surveys, as annotated (in red) by City staff. Part 1 (17 MB) Part 2 (17 MB)
Next, it appears that someone else - possibly Kimley-Horn, the traffic engineering firm the City hired to do the speed survey project - disagreed with the "downgrade to be consistent with adjacent street segment" excuse for lowering the speed on Mowry. (See NOTES in the Mowry portion of the Re-survey List, imaged below.)
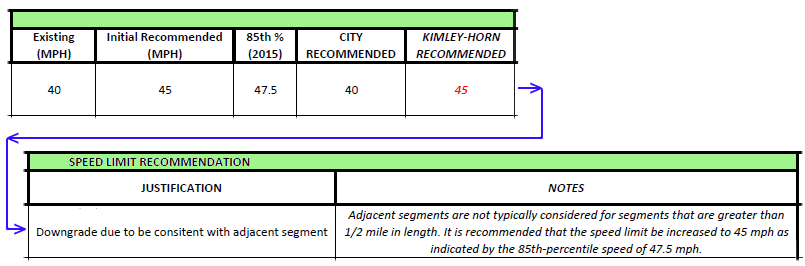
(Image 4, by highwayrobbery.net)
Mowry Portion of Re-survey List dated Sept. 15, 2015 (green shading added)
In November 2015 they published the
"Final" ETS book, and for Mowry it showed (below) that
within nine days of the creation of the Re-survey List
they had re-surveyed Mowry and had managed to obtain an
85th% of 39.0 to replace the 47.5 found in the March
2015 survey sheet. That dramatically lower 85th%
allowed the retention of the 40 mph speed limit called
for in the red ink annotated copy of the March survey
(above), and would later be used as justification for
the Feb. 1, 2016 shortening of the yellows.
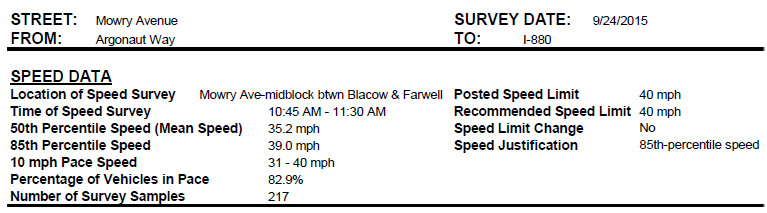
(Image 5, by highwayrobbery.net)
From the "Final" ETS book, published Nov. 2015, revision of Feb. 2016. See Note 5 above, for link to the book.
(The Mowry Avenue field survey sheet from Mar. 2015,
with its 47.5 85th%, was not included in the "Final" ETS
book, of course. The first evidence pointing to
the existence of the March survey sheet was the 47.5 mph
85th% shown - instead of 39.0 - in the Aug. 2015
spreadsheet the City sent us in Apr. 2016. See
Note 3, above.)
The City was not required to
shorten the yellows to conform with the 39.0 mph 85th%
they published in the "Final" ETS book. It is
optional - CVC 21455.7 says, "A yellow
light change interval may exceed the minimum
interval..." - but on Feb. 1,
2016 they went ahead and shortened the yellows to 4.0,
even though they should have been able to predict that
the dramatically shorter yellows would increase red
light running and make the intersections more dangerous.
In late 2016 the 4.7 yellows came
back! We don't know for sure the date the City
made the change, but the ticket counts suggest it was in
October and some signal
logs (highlighting added by City) say it may have
been Oct. 24. The return to 4.7 yellows may have
happened because City employees became concerned that
they could be prosecuted for switching the
surveys.
It's interesting that after the yellows were
returned to 4.7, ticketing did not immediately drop
all the way down to the late 2015 levels; at
Mowry/Blacow it was twice as high during the first
two months after the change.
A Fractional Refund - And,
the Yellows Would be Shortened Again
In the Feb. 22, 2017 East Bay Times
article where the City first admitted that it had
shortened the yellows - it continued to blame an intern
for the error! - it revealed that it would ask the court
to refund approx. 1000 tickets issued during the first
two months after the yellows were shortened.
The EBT reported:
"(Public Works Director) Larsen said the two-month
time frame is fair because drivers presumably could have
adjusted to the shorter yellow lights after a while. That
means the recipients of more than 3,000 other tickets
issued during the rest of the nine-month stretch of
shorter yellow lights won’t be reimbursed."
Here it should be noted that as of Feb.
2017 the City had $302 million in the bank,
up $26 million from Feb. 2016.
The Feb. 22 EBT article also said:
"He (Larsen) said for consistency, the city will
eventually change all the yellow times across the Mowry
Avenue corridor to 4.3 seconds."
[On July 31, 2017 the City announced a change, to 4.5
seconds. See Latest News, below.]
On Mar. 6, 2017 the City issued a press
release which said:
"Any motorist who is determined to have been affected by
an automated red-light citation at these intersections
between February 1, 2016, through April 7, 2016, will be
contacted by the City of Fremont via US mail."
An Apr. 13 East Bay Times article quoted the Court as saying that it cannot refund the (approx.) 1000 tickets because the fine money has already been distributed and cannot be retrieved. The Court also announced:
“Institutionally or globally,
we’re not doing anything.“ "If people still feel they
were incorrectly
assessed that amount, they can always come in and
get in front of one of our traffic commissioners and
make their case, and seek to have a traffic
commissioner order a refund.”
(It should be noted that when the City of South San Francisco had a nearly identical situation, involving 6000 tickets, the city and its superior court were able to arrange a full refund and expungement of all the tickets.)
On May 10, 2017 the City issued a press
release announcing that the City had offered to
refund $147 to 672 of the (approx. 4000) motorists
ticketed. In a story
(archived
copy) it broadcast later that day, KTVU
wrote:
"(Public Works Director) Larsen said the
City can't rebate the entire ticket since 70 percent of it
goes to state and county programs which are out of the
City's control."
Larsen also claimed:
"There isn't any recourse that we have to
dismiss a ticket that was valid and legally issued."
"It's a challenging issue and there isn't a perfect
solution."
(It should be noted - again - that when
the City of South San Francisco had a nearly
identical situation, the city and its superior court
were able to
arrange
a full refund and expungement of all the tickets.)
The Refund Shrinks Even
More
By Nov. 2017 the City had mailed out
244 refund checks totaling $34,983. The City's
logs (linked below) revealed that the City mailed
notifications to only (approx.) half of those who got
tickets during the 2+ month eligibility period listed in
the Mar. 6 press release above.
List
of Those Notified by Mail
First
Batch of Refund Checks Mailed
Second
Batch of Refund Checks Mailed
Third
Batch of Refund Checks Mailed
Fourth
Batch of Refund Checks Mailed
Latest News
On July 31, 2017 the City sent out a press
release (archived
copy) revealing that during that week they would
be adjusting the yellow timing for signals all over
town.
The press release did not disclose all
the changes, but did say that at the two cameras on
Mowry the yellow would be shortened by 0.2 second, to
4.5, and that on faster streets, the yellows for left
turns would be increased by 0.5 second, to 4.0.
Aug.
11, 2017 EBT Article
Do You Have One of These Tickets?
Please contact me.
Now that it is clear that both Fremont
and the Alameda County Court are wiggling out of
refunding the fines and clearing motorists' records, you
should consider contacting your state legislators
(assemblyperson and state senator). And, while you
have them on the phone, please talk to them about the
ongoing legislative efforts to allow speed cameras in
California (photo radar - speeding tickets mailed to
you). (In the 2017 session in Sacramento
there was Assembly Bill 342, and while it did not pass
there could be another attempt, in 2018 or 2019.)
More details are on the Action/Legis page.
The ups and downs were not confined to
Mowry Avenue. See Set # 9, below, about the
cameras on Mission.
Speeding Ticket?
If you have a speeding ticket
anywhere in Fremont, you should be concerned as it
wasn't just Mowry Avenue that was re-surveyed in late
2015. Eleven other street segments were
re-surveyed. This table of 85th
Percentile speeds and recommended posted speeds shows
that even though the initial recommendation (probably
by Kimley-Horn, the engineering firm the City hired to
conduct the surveys) was to increase the posted speed
on ten of the twelve segments, when it was all over
there were no increases.
| Fremont
ETS Surveys: Road Segments Surveyed Twice in
2015 |
|||||||
| Street |
2001 |
2008 |
June |
Called |
Nov. |
Segment |
|
| Segment |
Final |
Final |
2015 |
for in Red |
2015 |
# in |
|
| Survey |
Survey |
Draft |
Annotated |
"Final" |
2015 |
||
| Book |
Book |
Survey |
2015 |
Survey |
Surveys |
||
| Book |
Survey |
Book |
|||||
| Recc. |
|||||||
| Blacow Central to Thornton |
85th % |
42 avg |
39.7 |
42.9 |
39.6 |
16 |
|
| Recc. Posted |
35 & 40 |
35 |
40 |
- |
35 |
||
| Central Fremont to Blacow |
85th % | 39 avg |
40.6 |
42.7 |
37.6 |
22 |
|
| Recc. Posted | 35 |
35 |
40 |
35 |
35 |
||
| Fremont Mowry to Stevenson |
85th % | 42 avg |
45.7 |
43.8 |
34.1 |
52 |
|
| Recc. Posted | 35 & 40 |
40 |
40 |
35 |
35 |
||
| Kato Warm Springs to Milmont |
85th % | 52 |
38.5 |
46.3 |
43.5 |
74 |
|
| Recc. Posted | 40 |
40 |
45 |
- |
40 |
||
| Kato Milmont to Warren |
85th % | 36 avg |
43.9 |
49.5 |
38.6 |
75 |
|
| Recc. Posted | 35 |
40 |
50 |
45 |
40 |
||
| Mowry Argonaut to I-880 |
85th % | 47.0 |
45.4 |
47.5 |
39.0 |
87 |
|
| Recc. Posted | 40 |
40 |
45 |
40 |
40 |
||
| Osgood Washington to Grimmer |
85th % | 39.5 avg |
43.6 avg |
46.7 avg |
44.9 |
94 |
|
| Recc. Posted | 35 & 40 |
40 |
45 |
40 |
40 |
||
| Paseo Padre Ardenwood to Fremont * |
85th % | 47 avg |
43.0 |
45.9 |
45.2 |
99* |
|
| Recc. Posted | 35 & 40 |
40 |
45 |
- |
40 |
||
| Paseo Padre Thornton to Peralta |
85th % | 46 |
47.7 |
47.8 |
37.9 |
102 |
|
| Recc. Posted | 40 |
45 |
45
|
40 |
40 |
||
| Paseo Padre Stevenson to Driscoll |
85th % | 42 |
41.0 |
42.8 |
38.5 |
105 |
|
| Recc. Posted | 35 |
35 |
40 |
35 |
35 |
||
| Paseo Padre Driscoll to Washington |
85th % | 37 |
41.0 |
45.3 |
39.6 |
106 |
|
| Recc. Posted | 30 |
35 |
45 |
35 |
35 |
||
| Paseo Padre Washington to Durham |
85th % | 44 avg |
40.5 avg |
42.6 |
38.3 |
107 |
|
| Recc. Posted | 30 |
35 |
40 |
35 |
35 |
||
| |
|||||||
| Table 2. By
highwayrobbery.net Updated 6-8-17 Source documents: See Notes 1, 2, 5, 6, Parts 1 & 2 of the survey annotated in red, and the Re-survey List, at links above. *Segment 99 was not listed in the Re-Survey List but was re-surveyed in Dec. 2015. |
|||||||
Four More Unjustified Speed Limits
The City used means other than
re-surveying to produce lower-than-recommended speed
limits on the four following segments.
Lakeview (Fremont to Warren), Scott
Creek (Warm Springs to I-680), and Stewart (Albrae to
Boyce) were given speed limits 5 mph lower than those
initially recommended, despite the concerns raised in
the NOTES column of the Re-survey List (link
above). (The initial recommendations, and the
contents of the NOTES column, are believed to be
by Kimley-Horn, the traffic engineering firm
the City hired to do the speed survey project .)
Boscell Road, between Stewart and Auto
Mall: Per the Re-survey List, the City deleted the
two fastest cars from the survey sample - they called
them "outliers" even though they were going only 50 mph
- and by doing so was able to change the 85th% from 40.0
to 39.8, which they used to take the
no-justification-required 5 mph reduction permitted by
CVC 21400(b) after rounding up has occurred.
Suggested reading:
A similar situation involving the red
light cameras in Oakland pitted the ticket issuers (the
OPD) against the traffic engineers. See Set # 1 on
the Oakland Docs page.
How Much Money Does Fremont Make, and
what have they done to protect that income stream? - Set
# 3, below.
The email linked in Set # 4, below, in
which the Director of Public Works says that the City's
policy is to round yellows up to to the nearest
half-second - which they didn't do on Mowry.
The City Survey Documents Linked Above,
Listed Chronologically by When Created
The 2001 ETS Book (link at Note 1)
The 2008 ETS Book (at Note 2)
The June 2015 Draft ETS Book (at Note 6)
The Aug. 2015 Spreadsheet (at Note 3)
The Mar. 2015 Draft Survey, with Later Annotations in
Red, in Two Parts
The Sep. 2015 Re-survey List
The "Final" Survey, Cover Date Nov. 2015, Revision of
Feb. 2016 (at Note 5)
Fremont Docs Set # 2
Ticket Count
Tables
Updated 6-27-20
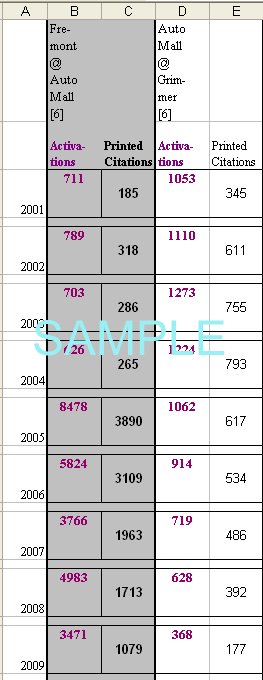
Table A: 2001 - 2005 monthly ticket
totals, by intersection.
Table B: 2001 - 2018 annual ticket totals by
intersection, and 2009 - 2019 monthly totals by
intersection.
Table C: 2010 - 2018 right turns on red, monthly,
three intersections.
D: Official source documents for ticket tables.
Table A: 2001 - 2005 Tickets
Paid, and Detail for 2005
Total Violations Recorded (some months), Notices Printed, and Citations Paid at Court [4]
| Cam # |
AMFR 01 |
AUGR 01 |
BLMO 01 |
DEFR 01 |
DEPP 01 |
FRMO 01 |
FRPP 01 |
FRST 01 |
MOFA 01 |
STBL 01 |
|
||
| Fre- mont @ Auto Mall [6] |
Auto Mall @ Grim- mer [6] |
Mowry @ Blacow [6] |
Fre- mont @ De- coto [6] |
De- coto @ Paseo Padre [6] |
Fre- mont @ Mowry [6] |
Fre- mont @ Paseo Padre [6] |
Fre- mont @ Stev- enson [6] |
Mowry @ Far- well [6] |
Stev- enson & Blacow [6] |
Total Recorded/ Notices Printed [1] [4] |
Total
Cites Paid [4] |
||
| Aug00 |
[5] | ||||||||||||
| Sep00 |
[5] | ||||||||||||
| Oct00 |
0 |
0 |
0 |
0 |
0 |
19 |
0 |
0 |
0 |
19 |
|||
| Nov00 |
[5] | ||||||||||||
| Dec00 |
[5] | ||||||||||||
| 2000 |
|||||||||||||
| Jan01 |
[5] | 63 [7] |
|||||||||||
| Feb01 |
[5] | 145 |
|||||||||||
| Mar01 |
[5] | 168 |
|||||||||||
| Apr01 |
0 |
35 |
78 |
100 |
0 |
6 |
12 |
12 |
0 |
243 |
183 |
||
| May01 |
[5] | 212 |
|||||||||||
| Jun01 |
[5] | 208 |
|||||||||||
| Jul01 |
[5] | 196 |
|||||||||||
| Aug01 |
[5] | 322 |
|||||||||||
| Sep01 |
[5] | 238 |
|||||||||||
| Oct01 |
30 |
42 |
168 |
68 |
0 |
26 |
22 |
17 |
0 |
373 |
329 |
||
| Nov01 |
[5] | 276 |
|||||||||||
| Dec01 |
[5] | 242 |
|||||||||||
| 2001 |
|||||||||||||
| Jan02 |
[5] | 259 |
|||||||||||
| Feb02 |
[5] | 212 |
|||||||||||
| Mar02 |
[5] | 217 |
|||||||||||
| Apr02 |
18 |
40 |
127 |
67 |
0 |
23 |
25 |
26 |
0 |
326 |
211 |
||
| May02 |
[5] | 272 |
|||||||||||
| Jun02 |
[5] | 221 |
|||||||||||
| Jul02 |
[5] | 238 |
|||||||||||
| Aug02 |
[5] | 377 |
|||||||||||
| Sep02 |
[5] | 269 |
|||||||||||
| Oct02 |
41 |
43 |
182 |
105 |
0 |
29 |
31 |
44 |
0 |
475 |
303 |
||
| Nov02 |
[5] | 308 |
|||||||||||
| Dec02 |
[5] | 303 |
|||||||||||
| 2002 |
|||||||||||||
| Jan03 |
[5] | 436 |
|||||||||||
| Feb03 |
[5] | 248 |
|||||||||||
| Mar03 |
[5] | 299 |
|||||||||||
| Apr03 |
26 |
47 |
129 |
51 |
0 |
21 |
44 |
58 |
0 |
376 |
252 |
||
| May03 |
[5] | 307 |
|||||||||||
| Jun03 |
[5] | 288 |
|||||||||||
| Jul03 |
[5] | 360 |
|||||||||||
| Aug03 |
[5] | 449 |
|||||||||||
| Sep03 |
[5] | 551 |
|||||||||||
| Oct03 |
27 |
65 |
203 |
63 |
339 |
23 |
35 |
54 |
0 |
809 |
450 |
||
| Nov03 |
[5] | 432 |
|||||||||||
| Dec03 |
[5] | 500 |
|||||||||||
| 2003 |
|||||||||||||
| Jan04 |
[5] | 479 |
|||||||||||
| Feb04 |
[5] | 407 |
|||||||||||
| Mar04 |
[5] | 519 |
|||||||||||
| Apr04 |
21 |
79 |
201 |
36 |
218 |
24 |
37 |
14 |
182 |
812 |
549 |
||
| May04 |
[5] | 553 |
|||||||||||
| Jun04 |
[5] | 607 |
|||||||||||
| Jul04 |
27 |
71 |
236 |
60 |
250 |
8 |
31 |
6 |
182 |
871 |
593 |
||
| Aug04 |
[5] | 669 |
|||||||||||
| Sep04 |
[5] | 491 |
|||||||||||
| Oct04 |
10 |
34 |
130 |
41 |
165 |
7 |
37 |
10 |
171 |
611 |
576 |
||
| Nov04 |
3 |
68 |
186 |
31 |
259 |
22 |
31 |
17 |
230 |
0 |
847 |
396 |
|
| Dec04 |
21 |
60 |
162 |
32 |
274 |
20 |
36 |
30 |
279 |
- |
914 |
562 |
|
| 2004 |
|||||||||||||
| Cam # |
AMFR 01 |
AUGR 01 |
BLMO 01 |
DEFR 01 |
DEPP 01 |
FRMO 01 |
FRPP 01 |
FRST 01 |
MOFA 01 |
STBL 01 |
|
||
| Fre- mont @ Auto Mall [6] |
Auto Mall @ Grim- mer [6] |
Mowry @ Blacow [6] |
Fre- mont @ De- coto [6] |
De- coto @ Paseo Padre [6] |
Fre- mont @ Mowry [6] |
Fre- mont @ Paseo Padre [6] |
Fre- mont @ Stev- enson [6] |
Mowry @ Far- well [6] |
Stev- enson & Blacow [6] |
Total Recorded/ Notices Printed [1] [4] |
Total
Cites Paid [4] |
||
| Jan05 |
18 |
41 |
161 |
24 |
247 |
23 |
30 |
22 |
196 |
- |
762 |
525 |
|
| Feb05 |
56 |
55 |
157 |
31 |
243 |
7 |
34 |
22 |
150 |
- |
755 |
490 |
|
| Mar05 |
592 |
60 |
97 |
31 |
231 |
14 |
23 |
31 |
195 |
- |
1274 |
577 |
|
| Apr05 |
526 |
53 |
97 |
31 |
278 |
17 |
21 |
27 |
242 |
- |
1292 |
657 |
|
| May05 |
503 |
58 |
106 |
21 |
259 |
36 |
24 |
6 |
240 |
0 |
1253 |
719 |
|
| Jun05 |
329 |
56 |
112 |
30 |
209 |
16 |
30 |
26 |
252 |
- |
1060 |
863 |
|
| Jul05 |
236 |
42 |
113 |
36 |
211 |
20 |
24 |
26 |
186 |
0 |
894 |
627 |
|
| Aug05 |
293 |
46 |
71 |
23 |
199 |
27 |
16 |
33 |
135 |
48 |
891 |
792 |
|
| Sep05 |
310 |
58 |
69 |
24 |
194 |
14 |
6 |
7 |
108 |
381 |
1171 |
615 |
|
| Oct05 [8] |
Rt: 19 St: 1 |
St: 20 |
St: 20 | St: 20 | St: 20 | - |
- |
- |
St: 20 | Rt: 17 St: 3 |
|||
| Oct05 |
407 |
46 |
116 |
26 |
169 |
- |
- |
- |
223 |
659 |
1646 |
432 |
|
| Nov05 |
280 |
44 |
141 |
23 |
150 |
- |
- |
- |
284 |
377 |
1299 |
||
| Dec05 |
|||||||||||||
| 2005 |
[ ] indicates a footnote.
[1] Totals are as provided by the City.
[2] YTD = Year-to-date total.
[3] Un-used columns are to allow for later expansion of City's system.
[4] Any figures in red type (or, if you are looking at this table in black and white, the upper figure when there are two or more figures in a cell) are what RedFlex calls Total Violations, or all incidents recorded by the cameras, and due to time limitations may have been posted only for selected months or locations (or not at all). If there is sufficient public interest, the remaining months will be posted. The figures in black type are what RedFlex calls Notices Printed, and represent the sum of genuine citations issued (those filed with the court) plus Nominations mailed (not filed with the court, a.k.a. Snitch Tickets). Figures in blue type (or, if you are looking at this table in black and white, solely in the rightmost column) are total Cites Paid (at the court), per RedFlex's monthly invoices to the City.
[6] The camera enforcement is on traffic on the first-named street, but the direction of enforcement (north, south, east, west, thru, left) is not yet available, except as noted for October 2005.
[7] Cites paid from 9-24-00 to 1-31-01.
[8] Highwayrobbery.net requested details about the first and last 10 tickets issued by each camera during that month. The information posted in italic type shows how many of the 20 tickets were for right turns and how many were for straight-through movements.
Table B:
2001
- 2019 Annual Totals by Intersection
2009 - 2020 Monthly Totals by Intersection
2013 - 2019 Annual Totals by
Movement (Straight, Right, Left)
Table
B (Excel)
(Also see Set # 9, below.)
Table C: 2010 - 2019 Right
Turns on Red (RTOR), Sample Months, for Three Cameras
In the second half of 2019 the number
of RTOR citations was:
AMFR: 663
MIMO: 168
STBL: 527
Doubling the numbers above, the full-year count
(projected) from those three cameras would be 2716,
which is 26% higher
than the count for the previous year.
Table C shows that between July and
December 2019, there was an (approx.) doubling of the
percentage of RTOR "activations" approved for issuance
as a citation, at AMFR and STBL.
The other seven cameras in Fremont
generated a total of 13 right turn citations during the
second half of 2019.
2001 - 2009 Annual Reports
2001 - 2005 Reports
2009 Month-by-Month
2010 Month-by-Month
2011 Month-by-Month
2012 Month-by-Month, to Oct.
2012 Right Turns
Nov. 2012 to June 2013 Month-by-Month
July 2013 Report
Aug. 2013 Report
Sept. 2013 Report
Oct. & Nov. 2013 Reports
Dec. 2013 to June 2014 Month-by-Month
July 2014 to Jan. 2015 Month-by-Month
Mar. 2015 to May 2015 Month-by-Month
June 2015 to Mar. 2016 Month-by-Month
Feb. 2015 & Feb. 2016 to June 2016 Month-by-Month
July 2016 to Oct. 2016
Nov. & Dec. 2016 Reports
Jan. 2017 Report
Feb. & Mar. 2017 Reports
Apr. & May 2017 Reports
May, June & July 2017 Reports
July & Aug. 2017 Reports
Sept. & Oct. 2017 Reports
Oct. 2017 to Mar. 2018 Reports
2018 Right Turns
Apr. 2018 to July 2018 Reports
Aug. 2018 to Dec. 2018
Jan. 2019 to Mar. 2019
Apr. 2019 to Sept. 2019
Oct. 2019 to Dec. 2019
2019 Rt Turns, 3rd Qtr
2019 Rt Turns, 4th Qtr
Jan. 2020 to May 2020 Reports
Annual CVC 21455.5(i) Reports, 2013 Onward, Fremont only, with Breakout by Movement (straight, right, left)
Annual CVC 21455.5(i) Reports, 2013 Onward, All Cities, with Breakout by Movement (straight, right, left)
Fremont Docs Set # 3
How Much Money Does Fremont Make?
The City pays RedFlex $600,000 per year (see Set # 6, below). To estimate Fremont's internal costs to run the program (mostly labor), we started with the $222,600 per year that the City of San Mateo charged the City of Millbrae to process approx. 1600 tickets a month, deducted about 1/3 because Fremont issues fewer tickets than that, and got $144,000. For a total cost of $744,000.
Our Rule of Thumb is that the revenue flowing from the court to a city is about $100 for each red light camera ticket issued, so Fremont's gross revenue has been about $1.1 million annually, against expenses of $744,000, yielding a net profit of $356,000.
What have they done to keep the income up?
When straight-thru ticketing went down, they turned on right turn ticketing. An example of that is on the last page (page 59 of the pdf) of the 2016 DKS study discussed in Set # 9, below.
They haven't explored countermeasures. See Set # 9, below.
They have manipulated the yellows. See Set # 1, above.
And, in June 2020 the Council voted to add two new cameras which their staff said would add nearly $1 million to the net profit. (For more details see Set # 6 below.)
Fremont Docs Set # 4
Who Gets the
Tickets?
A June 2013 email
from the Public Works Director to a motorist revealed
that only 31% of Fremont's tickets went to City
residents.
Food for thought: 31% is
actually rather high; in Menlo Park, only
10% of the tickets went to that City's residents.
(Menlo Park ended its red light camera program in
2019.)
Fremont Docs Set # 5
Grand Jury Says: "Don't Hide the Emails"
In 2015 the Alameda County Grand Jury told the City of Fremont that it must cease its practice of destroying emails after 30 days.
If you would like to read some grand jury reports from other counties, about their red light cameras and related issues, see the Grand Jury entry on the Site Index page.
The Contracts - City Pays More Than Double
June 16, 2020: Council Approved Two More Cams on Automall and Up-To-Seven-Year Extension (See Below)

Not the City's Official Logo
The original contract was expiring, so at the Sept. 13, 2005 council meeting the City Council approved a new contract with RedFlex. That contract included a unique compensation scheme so complicated that I had trouble telling if it complies with the CVC 21455.5 "pay-per-ticket" prohibition. (See Defect # 10.) Despite the complexity of the contract and its five-year term, there was absolutely no discussion of by the council before they voted to approve it. Staff Report and Minutes
2010: Another New Contract
Here is the staff report for the new seven-year contract which was approved at the June 1, 2010 council meeting.
The new contract reduced the monthly rent for each of the ten existing cameras to $4800. Despite that lower price the City will overpay by $2,352,000 over the seven years (when compared with a $2000 target price - see FAQ # 17).
2013 Amendment to Annual Pricing Adjustment
Early 2013 Invoices showed that the rent had risen to $4995. With that increase, the amount by which the City will overpay during the seven years 2010 - 2017 rose to (at least) $2,445,600. To cover that extra rent, the City will need to issue an extra 24,456 tickets (assuming that the City receives $100 of revenue from each ticket issued).
As of early 2016 the City still was paying $4995 per camera.
The City can cancel the contract anytime, on 10 days notice.
In June 2017 the city manager approved a one-year extension of the contract, which will automatically renew
for two more one year extensions (on June 30, 2018 and June 30, 2019) unless the City gives notice 30 days in advance of those dates.
June 16, 2020, 7 pm: Council Approved Two More Cams and Up-To-Seven-Year Extension
The staff report recommended adding two more cams on Automall, (which will generate mostly right turn tickets).
The staff report claimed a 62% reduction in collisions since the original cameras were put in (pg. 4, top), but that claim was based upon a comparison of apples and oranges: If we look at the annual reports the City and RedFlex were required to submit to the Judicial Council beginning in 2013 (linked in Set # 2, above), there wasn't much of a reduction until 2017, and then it was dramatic, a 77% drop in one year.
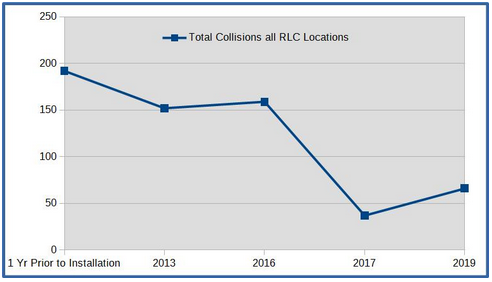
City/RedFlex did not submit collision stats in 2014, 2015 and 2018.
Fremont isn't the first city with questionable figures. In the City of Ventura, during a council meeting with the president of RedFlex in attendance, City staff stood up and presented a report claiming a 75% reduction - which instantly fell apart after a question from a councilmember. Ventura staff then offered her this explanation:
"The way the police department reports collisions now is vastly different than we did when we started this program. Now we only report - correct me if I'm wrong - now we only report injury or major property damage collisions. That's different. Our total collision numbers are down quite a bit because the reporting is different." (At 3:20:20 in the council meeting video of March 30, 2015.)
Two other RedFlex clients have claimed an even greater reduction than Fremont or Ventura: Sacramento, in 2018, and Victorville (now closed), in 2015, each claimed a reduction of 92%. (See those cities' Docs pages.)
Fremont's staff report included a table (page 3) showing that Fremont's fatal collisions have gone up with cameras, despite the better medical care and safer cars we have now (side airbags, anti-skid and automatic braking).
Per page 8 of the staff report the proposed new cameras - which will be at a huge shopping center and the 3rd and 4th cams on Automall - will bring the City a substantial new revenue stream, nearly $1 million, net, annually.
Two Letters
Post-meeting Article (Archived Copy)
Fremont Docs Set # 7
Why Do These Intersections Continue To Be So Dangerous?
Despite heavy ticketing for a long time, the cameras at three intersections continue to see unusually high numbers of straight-through violations. On Dec. 30, 2005 I received documents which may explain why.
All three intersections (Mowry at Blacow, Mowry at Farwell, Decoto at Paseo Padre) have 40 mph posted speed limits and, per the signal control charts received from the City, yellows set at 4.0 seconds, 0.1 above the minimum required in a 40 zone. [That was under the old rules, prior to Aug. 1, 2015. Under the new rules the yellow is to be based upon the 85th, rounded up. See Defect # 2, on the Home page.] However, both Mowry and Decoto are high speed streets, and one explanation for high ticket numbers can be a too-low posted speed limit and the too-short yellows that it allows.
Posted speeds are supposed to be determined, and justified, in an engineering survey done every five to seven years. Here are the surveys for Mowry and Decoto.
In these surveys, the "85th Percentile Speed" for the section of Mowry that has cameras is 47, and the 85th for Decoto is 46. By law, the traffic engineer (who writes the survey) is supposed to choose a speed limit that is just below the 85th percentile speed.
(The "85th Percentile Speed" is the speed at or below which 85 percent of the motorists travel, according to survey results.)
However, he can reduce the posted speed by an additional 5 mph increment if he cites, in the survey, a danger that would not be apparent to a driver on the street. That danger could be a hidden driveway, or a higher-than-average accident rate. Using Mowry's 85th as an example, he could post a 45 without giving any justification for doing so. But he could only move the limit down to 40 if he said that there is some non-obvious danger or that there was a higher-than-expected number of accidents - as he has done with Mowry (highlighted). (CVC 22358.5) (You can see an "informal discussion" of the law, in the Speeding Ticket section of the Links page.)
Examining the Surveys
Decoto
The Decoto survey does not seem to justify the 40 limit posted there - "high pedestrian activity" is something that would be apparent to a driver, and thus is not a legally proper reason to down-rate the speed on a street. If the speed limit was increased to 45, the yellow at the intersection with Paseo Padre would need to be set at a minimum of 4.3 seconds. [That was under the old rules, prior to Aug. 1, 2015. Under the new rules the yellow is to be based upon the 85th, rounded up. See Defect # 2, on the Home page.] This 0.3 increase would cut the number of violations, dramatically - probably in half - and make it a much safer intersection. (For those who would argue that violations would return to former levels after local drivers got used to the longer yellow, see FAQ # 6.)
Mowry
The Mowry survey cites the "high number of rear-end accidents" as justification for the down-rating to 40 mph. That is a factor that would not be apparent to a driver, so , technically, can be used to justify lowering the limit the extra 5 mph increment - and the short yellow that results. [That was under the old rules, prior to Aug. 1, 2015. Under the new rules the yellow is to be based upon the 85th, rounded up. See Defect # 2, on the Home page.] But the survey was based upon data from 1999 and 2000, just before the cameras were installed on Mowry. In light of the current understanding that red light cameras increase rear-enders, it seems unsafe to maintain short yellows that will cause drivers (those who have had a ticket, or know about the short yellows) to brake abruptly and increase the already-high number of rear-enders.
Additionally, the Mowry survey lists a 50th Percentile Speed of 42 mph. This tells us that the majority of motorists are exceeding the posted speed limit. This is significant because of People v. Goulet, in which the court ruled:
"...[T]he general rule [is that speed limits are to be] set at the 85th percentile speed or within 5 mph under that speed. Some speed limits may be justified because they are set five mph below the general rule, based on higher than expected accident rates or listed hidden hazards. Some speed limits may appeal to be unjustified because:
... 2. The speed limit makes violators of a large percentage of drivers."
*The "85th Percentile Speed" is the speed at or below which 85 percent of the motorists travel, according to survey results.
Fremont Docs Set # 8
"Late Time" Graphs
These graphs track violations recorded, not tickets issued.
Where there is a large number of long Late Time violations in a curb lane, it is believed to indicate heavy ticketing on right turns.
(The curb lane will be the lane with the highest lane number.)
The picture above is an example from another city.
Mission/Mohave 2010
Mission/Mohave 2011
Mission/Mohave 2012
All cameras, July 2012
All cameras, June 2013
Four cameras, late 2013 (AMFR, MIMO, MOFR, STBL)
All cameras, Aug. 2015
All cameras, Aug. 2016
Mission and Mowry, Mar. 2017
All cameras, Sept. 2017
All Cameras, Mar. 2018
All Cameras, Sept. 2019
Bar graphs are available for more than fifty other cities - see the list in the expanded version of Defect # 9.
Fremont Docs Set # 9
Mission / Mohave and Mission / Warm Springs
Longer Yellows = Much Lower Ticketing, for a While
The Cameras are Not Cutting Angle Crashes
City has No Interest in Non-Camera Countermeasures
Mission Blvd. is a State highway, so CalTrans sets the signal timing.
Mission/Mohave
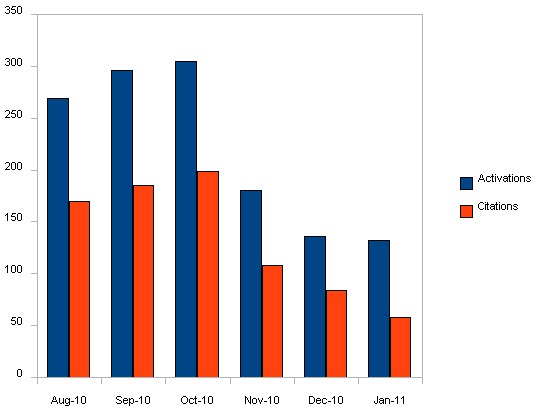
Portion of Bar Graph - for Full Bar Graph, Click on Link, Below
Full Bar Graph
This graph shows a big drop in running, and citations, after CalTrans lengthened the yellow at Mission/Mohave sometime in Nov. 2010.
The graph suggests that more than half of the Mission/Mohave tickets were unjustified, because the motorist was entrapped by the too-short yellow. Using monthly ticket counts and overall totals from Table B (above), we can see that at least 7874 tickets were issued at Mission/Mohave prior to the lengthening of the yellow. Will the City ever do a refund of the (approx.) 3937 tickets that would not have been issued had the yellow been long enough?
The data for the six years of operation after the 2010 lengthening shows that for nearly five years there was no "rebound" - ticketing at Mission/Mohave stayed down until late Summer 2015, when it was raised by about 50%, probably as part of an citywide attempt to compensate for the drop in ticketing at the locations where the yellows had to be lengthened on Aug. 1. (For more info about rebound, see FAQ # 6.)
A 2016 engineering study revealed that when CalTrans lengthened the Mission/Mohave yellow and straight-thru ticketing went down, the City turned on right turn ticketing. See the last page (page 59 of the pdf) of the 2016 DKS study discussed in Set # 10, below.
Mission/Warm Springs
On Nov. 29, 2012 CalTrans lengthened the yellow at Mission/Warm Springs from 4.3 seconds up to 5.0, and ticketing stayed down until a jump in Fall 2013 and another in Fall 2016.
SaferStreetsLA Report on Effect of Longer Yellows in Fremont
The Trend - Ticketing and Angle Crashes Both Up!
Citywide ticketing in Fremont - which should have dropped after years of enforcement - remains about the same.
At the two cameras on Mission, ticketing dropped 63% between 2010 and 2013, but then rose 29% between 2013 and 2014.
And in 2016, ticketing at Mission/Mohave was 83% greater than it was in 2014; Mission/Warm Springs was 96% greater.
An independent engineering study commissioned by the City in 2016 reported that angle crashes were up 43% at Mission/Mohave and up 55% at Mission/Warm Springs. (See page 10 of the pdf linked in Set # 10, below.)
That same engineering study revealed that City staff expressed no interest in countermeasures (at page 13 of the pdf):
"According to City of Fremont Staff, other safety features to improve safety and discourage red light violations were not considered prior to the installations of the ARLE systems [red light cameras] at either study intersection. To date, the City is satisfied with the operational benefits of the current ARLE system and have not explored other possible countermeasures."
Fremont Docs Set # 10
Encroachment Permits
Some of the City's cameras (those on Mission Blvd.) are located on CalTrans right-of-ways, so are operated under an encroachment permit obtained from CalTrans. HighwayRobbery.net obtained these documents from CalTrans, via a public records request.
Permit Application 2006, Issued 2007
April 2016 DKS Study, Part of Application for Permit Renewal
Permit Issued June 2016, Expiring June 2017
Some other cities operate cameras under encroachment permits. For more information about those cities and about CalTrans' criteria for the issuance of an encroachment permit, see the CalTrans section on the Links page.
Fremont Docs Set # 11
The Judges
I recommend doing a PC on Comm. Geoffrey Carter.
In late 2016, the Judicial Council removed Comm. Taylor Culver from the Alameda County Superior Court traffic bench.
Fremont Docs Set # 12
The Politicians
In 2014 Sen. Corbett "termed out," and was replaced by this person
Wieckowski, Author of the
anti-motorist bills SB 1 and AB 666
who will be running for re-election to the State Senate in 2022 if his current run for Alameda County Supervisor doesn't work out.
In March 2020 please don't vote for
him for Supervisor.
Send him back home to his
bankruptcy law practice.
As of 2019 he still is in the State Legislature in
Sacramento and was the author of SB 246 of 2019 (had
it passed it would have added a 10% tax to each
barrel of oil).
He was co-author of SB 1 which raised gas tax
and car registration fees beginning Nov. 2017 and
which was the subject of an attempted repeal,
by Prop. 6 on the Nov. 2018 ballot.
In 2013 he was the author of AB-666 which - had it
passed - would have increased the number of red
light camera tickets.
Before reaching the Legislature he was a member of
the Fremont City Council, and during his time on
the council he approved two extensions of
Fremont's contract with RedFlex: He was the
maker of the 2005 motion to extend the contract to
2010, and in 2010 he made the motion to extend the
contract to June 2017.
Fremont Docs Set # 13
More Coming
There may be some more Fremont information posted in the next few days. Mark your calendar to remind you to come back here and look!
---------------------------------
RED LIGHT CAMERAS
www.highwayrobbery.net
www.highwayrobbery.net