Email
Address
Site
Index
by Subject
If
you haven't already done so, please read the
Oceanside section on the Camera Towns page
City of Oceanside Documents
(Closed Late 2014)
Oceanside, pop. 158,000, is on the coast 30
miles north of San Diego.
Some of Oceanside's tickets can be ignored. If your "ticket" does not have the Superior Court's name and address on it, it is what I call a "Fake Ticket." For more details, see Set # 1, below, and the Fake Ticket section on the Your Ticket page.
Do you live in LA County? Was
Zev Yaroslavsky your County Supervisor? (Until
Nov. 2014, he represented the Third District, which
includes the central and western San Fernando Valley,
Malibu, Santa Monica, Venice, Beverly Hills, the City
of West Hollywood, and part of Hollywood.)

Sheila "Kuehl Kams" Kuehl, in 2007
During her career in the California
Legislature, Kuehl made three attempts to pass bills to
allow the use of automated speed enforcement (photo
radar) in California.
Kuehl will be up for re-election in Nov. 2018 and Nov. 2022.
Oceanside Docs Set # 1
Ticket
Counts
Total Violations Recorded, Notices Printed, Citations Issued [4]
New 11-10-05,
updated 11-21-14
Also on Nov. 10, the City provided a RedFlex "Customer Violations Report" having camera-by-camera lump-sum data for the entire period the camera system had been operating, but not including a month-by-month breakdown.
Snitch Tickets
The City's use of Nominations (a.k.a. Snitch
Tickets) probably explains,
(A) the discrepancy between the figures for
Notices Printed and Total Cites Issued (filed with the
court), and
(B) the month-to-month overlap in the serial
numbers.
See the table's footnotes for further details.
| Cam # |
COOC 01 |
COOG 01 |
MICA 01 |
MICA 03 |
OCCO 01 |
OGCO 01 |
VIEC 01 |
VIEC 03 |
|
|
|
|||
| College & Ocean- side [6] |
Mission & Canyon [6] |
Mission & Canyon [6] |
Ocean- side & College [6] |
Old Grove |
[3] | Notices Printed, Four Cameras Installed in 2004 |
Notices Printed, Four Cameras Added in 2011 |
All Cameras, Total Violations Recorded/ Notices Printed [1] [4] |
Total Violations Recorded/ Notices Printed/ Citations Issued per Invoices [1] [4] |
|||||
| Nov04 |
||||||||||||||
| Dec04 |
359 113 |
0 |
200 40 |
203 94 |
132 27 |
0 |
0 |
0 |
894 274 |
|||||
| 2004 |
||||||||||||||
| Jan05 |
450 158 |
0 |
344 101 |
266 152 |
279 198 |
0 |
0 |
0 |
1339 609 |
161 |
||||
| Feb05 |
325 111 |
0 |
323 107 |
204 125 |
204 129 |
0 |
0 |
0 |
1056 472 |
295 |
||||
| Feb05 |
378 96 |
0 |
330 129 |
255 150 |
280 52 |
0 |
0 |
0 |
1243 427 |
344 |
||||
| Apr05 |
687 203 |
0 |
333 32 |
250 70 |
206 90 |
0 |
0 |
0 |
1476 395 |
342 |
||||
| May05 |
177 |
|||||||||||||
| Jun05 [8] |
80 |
|||||||||||||
| Jul05 [8] |
17 4 |
0 |
191 18 |
308 11 |
162 2 |
0 |
0 |
0 |
678 35 |
41 |
||||
| Aug05 |
97 |
|||||||||||||
| Sep05 |
131 |
|||||||||||||
| Oct05 |
201 |
|||||||||||||
| 9 Mos. [7] |
2149 623 |
0 |
2785 558 |
2529 691 |
2088 624 |
0 |
0 |
0 |
9551 2496 |
1869 |
||||
| Nov05 |
||||||||||||||
| Dec05 |
||||||||||||||
| 2005 [10] |
277 (avg.) |
3327 (proj.) |
||||||||||||
| Jan06 |
42 25 |
0 |
225 117 |
209 139 |
166 120 |
0 |
0 |
0 |
642 401 |
|||||
| Feb06 |
||||||||||||||
| Mar06 |
||||||||||||||
| Apr06 |
739 317 |
|||||||||||||
| May06 |
||||||||||||||
| Jun06 |
||||||||||||||
| Jul06 |
101 42 |
0 |
187 58 |
115 38 |
169 52 |
0 |
0 |
0 |
572 190 |
|||||
| Aug06 |
||||||||||||||
| Sep06 |
||||||||||||||
| Oct06 |
582 290 |
|||||||||||||
| Nov06 |
||||||||||||||
| Dec06 |
||||||||||||||
| 2006 [10] |
300 (avg.) |
3594 (proj.) |
||||||||||||
| Jan07 |
57 25 |
0 |
131 57 |
87 46 |
188 98 |
0 |
0 |
0 |
463 226 |
|||||
| Feb07 |
||||||||||||||
| Mar07 |
||||||||||||||
| Apr07 |
490 208 |
|||||||||||||
| May07 |
||||||||||||||
| Jun07 |
||||||||||||||
| Jul07 |
96 45 |
0 |
156 62 |
115 52 |
233 99 |
0 |
0 |
0 |
600 258 |
|||||
| Aug07 |
||||||||||||||
| Sep07 |
||||||||||||||
| Oct07 |
528 272 |
|||||||||||||
| Nov07 |
||||||||||||||
| Dec07 |
||||||||||||||
| 2007 [10] |
241 (avg.) |
2892 (proj.) |
||||||||||||
| Jan08 |
62 34 |
0 |
81 36 |
64 39 |
147 91 |
0 |
0 |
0 |
354 200 |
|||||
| Feb08 |
||||||||||||||
| Mar08 |
||||||||||||||
| Apr08 |
585 251 |
|||||||||||||
| May08 |
||||||||||||||
| Jun08 |
||||||||||||||
| Jul08 |
51 31 |
0 |
239 64 |
82 44 |
200 108 |
0 |
0 |
0 |
572 247 |
|||||
| Aug08 |
||||||||||||||
| Sep08 |
||||||||||||||
| Oct08 |
507 266 |
|||||||||||||
| Nov08 |
||||||||||||||
| Dec08 |
||||||||||||||
| 2008 [10] |
241 (avg.) |
2892 (proj.) |
||||||||||||
| Jan09 |
93 58 |
0 |
59 24 |
65 42 |
40 19 |
0 |
0 |
0 |
257 143 |
|||||
| Feb09 |
||||||||||||||
| Mar09 |
||||||||||||||
| Apr09 |
345 178 |
|||||||||||||
| May09 |
||||||||||||||
| Jun09 |
||||||||||||||
| Jul09 |
81 45 |
0 |
128 39 |
84 54 |
73 39 |
0 |
0 |
0 |
366 177 |
|||||
| Aug09 |
||||||||||||||
| Sep09 |
||||||||||||||
| Oct09 |
302 182 |
|||||||||||||
| Nov09 |
||||||||||||||
| Dec09 |
||||||||||||||
| 2009 [10] |
170 (avg.) |
2040 (proj.) |
||||||||||||
| Jan10 |
62 44 |
0 |
86 43 |
54 28 |
28 17 |
0 |
0 |
0 |
230 132 |
|||||
| Feb10 |
||||||||||||||
| Mar10 |
109 58 |
|||||||||||||
| Apr10 |
462 247 |
|||||||||||||
| May10 |
||||||||||||||
| Jun10 |
||||||||||||||
| Jul10 |
103 61 |
0 |
177 62 |
102 53 |
14 9 |
0 |
0 |
0 |
396 185 |
|||||
| Aug10 |
||||||||||||||
| Sep10 |
93 65 |
0 |
161 54 |
95 48 |
26 15 |
0 |
0 |
0 |
375 182 |
|||||
| Oct10 |
338 188 |
|||||||||||||
| Nov10 |
||||||||||||||
| Dec10 |
||||||||||||||
| 2010 [10] |
166 (avg.) |
1984 (proj.) |
||||||||||||
| Jan11 |
88 60 |
0 |
136 57 |
107 71 |
44 35 |
0 |
0 |
0 |
375 223 |
|||||
| Feb11 |
0 |
0 |
0 |
0 |
||||||||||
| Mar11 |
0 |
3 1 |
0 |
0 |
||||||||||
| Apr11 |
71 47 |
163 96 |
120 45 |
96 63 |
56 35 |
254 119 |
272 86 |
285 122 |
190 |
423 |
1317 613 |
|||
| May11 |
144 66 |
265 145 |
288 127 |
372 134 |
190 |
472 |
1451 662 |
|||||||
| Jun11 |
117 61 |
235 95 |
287 134 |
313 119 |
173 |
409 |
1306 582 |
|||||||
| Jul11 |
96 63 |
128 56 |
173 51 |
78 40 |
48 14 |
265 91 |
264 108 |
315 96 |
168 |
351 |
1367 519 |
|||
| Aug11 |
||||||||||||||
| Sep11 |
||||||||||||||
| Oct11 |
141 68 |
206 67 |
205 119 |
279 163 |
173 |
417 |
1178 590 |
|||||||
| Nov11 |
||||||||||||||
| Dec11 |
||||||||||||||
| 2011 [10] |
186 (avg.) |
414 (avg.) |
6378 (proj.) |
|||||||||||
| Jan12 |
132 |
336 |
1060 468 |
|||||||||||
| Feb12 |
153 |
336 |
1079 489 |
|||||||||||
| Mar12 |
137 65 |
182 47 |
217 117 |
343 188 |
151 |
417 |
1245 568 |
|||||||
| Apr12 |
135 |
349 |
1153 484 |
|||||||||||
| May12 |
134 |
299 |
1228 433 |
|||||||||||
| Jun12 |
99 |
237 |
1249 336 |
|||||||||||
| Jul12 |
141 |
322 |
1184 463 |
|||||||||||
| Aug12 |
133 61 |
197 76 |
224 80 |
279 174 |
142 |
391 |
1230 533 |
|||||||
| Sep12 |
93 46 |
121 54 |
170 40 |
98 35 |
78 38 |
213 77 |
183 49 |
284 150 |
159 |
330 |
1240 489 |
|||
| Oct12 |
144 |
298 |
1185 442 |
|||||||||||
| Nov12 |
105 |
293 |
1103 398 |
|||||||||||
| Dec12 |
132 |
381 |
1159 513 |
|||||||||||
| 2012 [10] |
136 (avg.) |
332 (avg.) |
5616 |
|||||||||||
| Jan13 |
145 |
319 |
1034 464 |
|||||||||||
| Feb13 |
155 |
384 |
1061 539 |
|||||||||||
| Mar13 |
147 |
479 |
1255 626 |
|||||||||||
| Apr13 |
125 |
311 |
1191 436 |
|||||||||||
| May13 |
157 |
366 |
1353 523 |
|||||||||||
| Jun13 |
133 |
324 |
1321 457 |
|||||||||||
| Jul13 |
99 41 |
146 54 |
177 37 |
106 45 |
64 24 |
168 36 |
324 131 |
311 101 |
147 |
322 |
1395 469 |
|||
| Aug13 |
118 |
337 |
1320 455 |
|||||||||||
| Sep13 |
147 |
313 |
1305 460 |
|||||||||||
| Oct13 |
126 |
361 |
1357 487 |
|||||||||||
| Nov13 |
120 |
373 |
1167 493 |
|||||||||||
| Dec13 |
119 |
430 |
1245 549 |
|||||||||||
| 2013 [10] |
137 (avg.) |
360 (avg.) |
5958 |
|||||||||||
| Jan14 |
98 |
281 |
1056 379 |
|||||||||||
| Feb14 |
126 |
397 |
1057 523 |
|||||||||||
| Mar14 |
64 35 |
149 81 |
180 45 |
79 47 |
82 42 |
132 39 |
240 134 |
332 198 |
169 |
452 |
1258 621 |
|||
| Apr14 |
146 |
388 |
1313 534 |
|||||||||||
| May14 |
136 |
271 |
1276 407 |
|||||||||||
| Jun14 |
147 |
322 |
1350 469 |
|||||||||||
| Jul14 |
105 |
337 |
1318 442 |
|||||||||||
| Aug14 |
1531 591 |
|||||||||||||
| Sep14 |
1382 521 |
|||||||||||||
| Oct14 |
1350 448 |
|||||||||||||
| Nov14 |
||||||||||||||
| Dec14 |
CLOSED |
|||||||||||||
| 2014 [10] |
132 (avg.) |
350 (avg.) |
5428 (proj.) |
|||||||||||
| Cam # |
COOC 01 |
COOG 01 |
MICA 01 |
MICA 03 |
OCCO 01 |
OGCO 01 |
VIEC 01 |
VIEC 03 |
|
|
|
|||
| [9] |
College & Ocean- side [6] |
Mission & Canyon [6] |
Mission & Canyon [6] |
Ocean- side & College [6] |
Old Grove |
[3] | Notices Printed, Four Cameras Installed in 2004 |
Notices Printed, Four Cameras Added in 2011 |
All Cameras, Total Violations Recorded/ Notices Printed [1] [4] |
Total Violations Recorded/ Notices Printed/ Citations Issued per Invoices [1] [4] |
This table made by highwayrobbery.net, using official documents obtained under the California Public Records Act.
Official report, Dec2004
Official reports, 2005 (3 monthy)
Official report, 2005 (9+ months)
Official reports, 2004 - 2010
Official reports, 2011 (new cameras only)
Official reports, 2010 - 2012
Official reports, 2011 - 2013 (includes all cameras in May & June 2011)
Official reports, 2013 - 2014
Official reports, 2006 - 2014
Official reports, 2014 Summer
[ ] indicates a footnote.
[1] Totals are as provided by the City.
[2] YTD = Year-to-date total.
[3] Un-used columns are to allow for later expansion of City's system.
[4] Except where noted otherwise, the figures given in the table are for the single calendar month indicated. Any figures in red type (or, if you are looking at this table in black and white, the upper figure when there are two or more figures in a cell) are what RedFlex calls Total Violations, or all incidents recorded by the cameras. The figures in black type are what RedFlex calls Notices Printed, and represent the sum of genuine citations issued (those filed with the court) plus any Nominations mailed (not filed with the court, a.k.a. Snitch Tickets). Due to time limitations data may have been posted to the table only for selected months or locations. If there is sufficient public interest, the remaining months or locations will be posted. Full official data has been received and is available at one of the links given above. Figures in blue type (or, if you are looking at this table in black and white, in italic type) are total Cites Issued (filed with the court), per RedFlex's monthly invoices to the City.
[6] The camera enforcement is on traffic on the first-named street, but the direction of enforcement (north, south, east, west, thru, left) is not yet available.
[7] Data covers Jan. 10 to Oct. 21, 2005 (official report is linked, above).
[8] Serial number data received only for two months shown.
[9] The title bar has been repeated solely for the convenience of the reader - there is no difference between it and the one at the top of the table.
[10] These annual totals, averages, or projections, are by highwayrobbery.net.
Oceanside Docs Set # 2
The Contract
(Program Closed in Late 2014 but May
Re-open)
In March 2010 the contract was renewed,
by a 3 - 1 vote (Ayes: Jack Feller, Kern,
Wood. No: Sanchez).
2010
Contract
At the Feb. 20, 2013 budget meeting,
the city council was presented with a report
indicating that it would cost $48,000 to terminate the
camera program early. Per a Feb. 21 Patch article,
"The council unanimously expressed the opinion that it
should die a natural death when the five-year contract
with the vendor expires in 2015." (Later, a 2014
U-T article
revealed that the expiration date may actually be a year
later, in 2016.)
U-T Editorial
On Oct. 10, 2013, several days before the hearing
scheduled for the city council in Poway to consider
their staff's recommendation
to remove the cameras from that City, the Union-Tribune
published an editorial
which recommended:
"Let’s eliminate every trace of this bad civic
memory.
And to city leaders in Oceanside, Vista,
Encinitas, Solana Beach and Del Mar — it’s time to do
likewise.
The cameras are simply not doing the intended job."
Closed Late 2014
At their Oct. 1, 2014 meeting the city council voted 3
- 2 to close the program. The City's contract with
RedFlex requires 45 days notice, so the system continued
to operate until the end of November. Article
On Nov. 4 a new councilmember was elected, and he
stated that he would like to review the decision to
remove the cameras.
On Nov. 21 the City responded to a public records
request and provided copies of internal
emails in which - among other things -
the Oceanside city manager and a Redflex rep discussed
some kind of continued operation of the cameras.
A Jan. 2, 2015 San Diego Reader article said that
Oceanside police Lt. Leonard Cosby said that while the
cameras were still in place and taking pictures, red
light tickets had not been issued since Dec. 1.
A Sept. 15, 2015 Seaside Courier article
said that, according to a City official, the
removal of the cameras was "moving forward."
This list of contracts and amendments was up-to-date as of 10-2-14.
Oceanside Docs Set # 3
"Late Time"
Graphs
These graphs track violations recorded, not tickets issued.
Where there is a large number of long Late Time violations in a curb lane, it is believed to indicate heavy ticketing on right turns.
(The curb lane will be the lane with the highest lane number.)
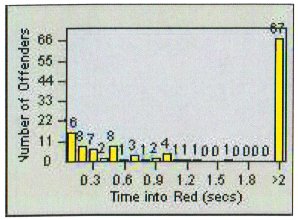
The picture above is an example from another city.
COOC 2006
COOC 2010
MICA-01 2006
MICA-01 2010
MICA-03 2006
MICA-03 2010
OCCO 2006
OCCO 2010
All Cameras, 2012
All Cameras, 2013
Bar graphs are available for more than fifty other cities - see the list in the expanded version of Defect # 9.
Oceanside Docs Set # 4
Info on City's
Website
On the police department's website it says there is an informational handout available at the front counter of the police department.
Public Announcement, Public Hearing, Warning Tickets
(See Defect # 6)
We have not yet asked the City of evidence that it made the public announcement required by CVC 21455.5(b).
Notice of the public hearing required by CVC 21455.6 was published on Dec. 6, 2003, and the hearing was held during the council meeting of Dec. 17.
In Oct. 2012 we asked the City for copies of some of the warning tickets issued for the new cameras installed in 2011 (required by CVC 21455.5(b) and the . The City replied that the warning tickets had been "purged."
More Coming
There may be some more information posted in the next few weeks. Mark your calendar to remind you to come back here and look!
RED LIGHT CAMERAS
www.highwayrobbery.net
www.highwayrobbery.net