If you haven't
already done so, please read the Ventura section
on the Camera
Towns page
City of Ventura
Documents
(and Information)
Ventura, pop. 101,000, is on the coast 53 miles west
of Los Angeles.
Contract up (5th
time!) for renewal on Sept. 21, 2020. See Set
# 2, below.
Some of Ventura's tickets can possibly be
ignored. If your "ticket" does not have the
Superior Court's name and address on it, it is what I
call a "Snitch Ticket." For more details, see
the Snitch Ticket section on the Your Ticket page.
Do you live in LA County? Was
Zev Yaroslavsky your County Supervisor? (He
represented the Third District, which includes the
central and western San Fernando Valley, Malibu, Santa
Monica, Venice, Beverly Hills, the City of West
Hollywood, and part of Hollywood.)

Sheila "Kuehl Cams" Kuehl, in 2007
During her career in the California
Legislature, Kuehl made three attempts to pass bills to
allow the use of automated speed enforcement (photo
radar) in California.
In 2016 she voted to put an additional LA County-wide sales tax, to go to Metro, on the Nov. 2016 ballot - and it passed. (See Measure M on the Action/Legis page, for more about that tax.)
Kuehl may be up for re-election in Nov. 2022.
If
you
have
a
ticket
from
the
City of Ventura, please be sure to contact
me.
Ventura Docs Set # 1
Ticket
Counts
Violations
Recorded/Processed and Citations Issued
New
11-22-04, updated 9-19-20
| Cam # |
BRJO |
CATH |
FOVI |
JONB |
MA10 |
MALE |
MAMI |
MIDE |
MITG |
TGDA |
THSE |
VIMO |
VIOP [8] |
VIRA |
VITG |
VITP -01 |
VITP -03 |
VIVA |
|
|
|||||
| Bris- tol @ John- son [6] |
Calif. @ Thom- pson [6] [7] |
Foot- hill @ Vic- toria [6] |
John- son @ North- bank [6] |
Main @ 101 [6] |
Main @ Lemon Grove [6] |
Main @ Mills [6] |
Mills @ Dean [6] |
Mills @ Tele- graph [6] |
Tele- graph @ Day [6] |
Thom- pson @ Sea- ward [6] |
Vic- toria @ Moon [6] |
Vic- toria @ Olivas Park [6] |
Vic- toria @ Rals- ton [6] |
Vic- toria @ Tele- graph [6] |
Vic- toria Sbd @ Tele- phone |
Tele- phone Ebd @ Vic- toria |
Vic- toria @ Valen- tine [6] |
Monthly Payment from the Court (thousands) [10] |
Total Notices Printed as % of Violations Recorded |
Total Pro- cessed/ Issued [1] |
Total Citations Issued/ Left Turn Citations Per CVC 21455.5(i) Annual Reports [11] |
||||
| Jul01 |
|||||||||||||||||||||||||
| Aug01 |
|||||||||||||||||||||||||
| Sep01 |
1253 526 |
||||||||||||||||||||||||
| Oct01 |
89 54 |
67 25 |
75 41 |
148 56 |
218 101 |
59 7 |
255 112 |
202 69 |
193 85 |
1306 550 |
|||||||||||||||
| Nov01 |
14 9 |
989 356 |
|||||||||||||||||||||||
| Dec01 |
26 17 |
1131 510 |
|||||||||||||||||||||||
| 2001 |
8212 3338 |
||||||||||||||||||||||||
| Jan02 |
1043 555 |
||||||||||||||||||||||||
| Feb02 |
|||||||||||||||||||||||||
| Mar02 |
1304 648 |
||||||||||||||||||||||||
| Apr02 |
13 11 |
1134 421 |
|||||||||||||||||||||||
| May02 |
|||||||||||||||||||||||||
| Jun02 |
|||||||||||||||||||||||||
| Jul02 |
1154 572 |
||||||||||||||||||||||||
| Aug02 |
|||||||||||||||||||||||||
| Sep02 |
1207 541 |
||||||||||||||||||||||||
| Oct02 |
12 5 |
1300 670 |
|||||||||||||||||||||||
| Nov02 |
|||||||||||||||||||||||||
| Dec02 |
|||||||||||||||||||||||||
| 2002 [2] |
6814 (proj.) |
||||||||||||||||||||||||
| Jan03 |
953 445 |
||||||||||||||||||||||||
| Feb03 |
|||||||||||||||||||||||||
| Mar03 |
1100 469 |
||||||||||||||||||||||||
| Apr03 |
937 367 |
||||||||||||||||||||||||
| May03 |
|||||||||||||||||||||||||
| Jun03 |
|||||||||||||||||||||||||
| Jul03 |
1149 594 |
||||||||||||||||||||||||
| Aug03 |
|||||||||||||||||||||||||
| Sep03 |
989 485 |
||||||||||||||||||||||||
| Oct03 |
6 |
15 |
14 |
29 |
6 |
58 |
7 |
5 |
28 |
31 |
33 |
25 |
46 |
73 |
10 |
42 |
753 428 |
||||||||
| Nov03 |
|||||||||||||||||||||||||
| Dec03 |
|||||||||||||||||||||||||
| 2003 [2] |
5576 (proj.) |
||||||||||||||||||||||||
| Jan04 |
925 414 |
||||||||||||||||||||||||
| Feb04 |
|||||||||||||||||||||||||
| Mar04 |
677 341 |
||||||||||||||||||||||||
| Apr04 |
11 8 |
1238 582 |
|||||||||||||||||||||||
| May04 |
|||||||||||||||||||||||||
| Jun04 |
|||||||||||||||||||||||||
| Jul04 |
860 406 |
||||||||||||||||||||||||
| Aug04 |
|||||||||||||||||||||||||
| Sep04 |
1022 311 |
||||||||||||||||||||||||
| Oct04 |
4 |
9 |
5 |
97 |
14 |
13 |
20 |
6 |
5 |
30 |
14 |
37 |
13 |
52 |
61 |
36 |
13 |
698 429 |
|||||||
| Nov04 |
|||||||||||||||||||||||||
| Dec04 |
|||||||||||||||||||||||||
| 2004 [2] |
4966 (proj.) |
||||||||||||||||||||||||
| Jan05 |
897 481 |
||||||||||||||||||||||||
| Feb05 |
|||||||||||||||||||||||||
| Mar05 |
911 495 |
||||||||||||||||||||||||
| Apr05 |
5 4 |
817 386 |
|||||||||||||||||||||||
| May05 |
|||||||||||||||||||||||||
| Jun05 |
|||||||||||||||||||||||||
| Jul05 |
869 255 |
||||||||||||||||||||||||
| Aug05 |
|||||||||||||||||||||||||
| Sep05 |
962 339 |
||||||||||||||||||||||||
| Oct05 |
9 5 |
957 347 |
|||||||||||||||||||||||
| Nov05 |
|||||||||||||||||||||||||
| Dec05 |
|||||||||||||||||||||||||
| 2005 [2] |
4606 (proj.) |
||||||||||||||||||||||||
| Jan06 |
852 398 |
||||||||||||||||||||||||
| Feb06 |
|||||||||||||||||||||||||
| Mar06 |
1058 480 |
||||||||||||||||||||||||
| Apr06 |
12 2 |
793 307 |
|||||||||||||||||||||||
| May06 |
|||||||||||||||||||||||||
| Jun06 |
|||||||||||||||||||||||||
| Jul06 |
982 328 |
||||||||||||||||||||||||
| Aug06 |
|||||||||||||||||||||||||
| Sep06 |
903 359 |
||||||||||||||||||||||||
| Oct06 |
6 2 |
809 308 |
|||||||||||||||||||||||
| Nov06 |
|||||||||||||||||||||||||
| Dec06 |
|||||||||||||||||||||||||
| 2006 [2] |
4360 (proj.) |
||||||||||||||||||||||||
| Jan07 |
0 0 |
836 429 |
|||||||||||||||||||||||
| Feb07 |
0 0 |
725 409 |
|||||||||||||||||||||||
| Mar07 |
0 0 |
774 352 |
|||||||||||||||||||||||
| Apr07 |
0 0 |
9 3 |
771 341 |
||||||||||||||||||||||
| May07 |
0 0 |
881 332 |
|||||||||||||||||||||||
| Jun07 |
0 0 |
792 370 |
|||||||||||||||||||||||
| Jul07 |
0 0 |
828 373 |
|||||||||||||||||||||||
| Aug07 |
64 0 |
899 395 |
|||||||||||||||||||||||
| Sep07 |
72 18 |
993 352 |
|||||||||||||||||||||||
| Oct07 |
76 40 |
331 1 |
1329 542 |
||||||||||||||||||||||
| Nov07 |
60 38 |
1797 458 |
|||||||||||||||||||||||
| Dec07 |
62 31 |
1801 376 |
|||||||||||||||||||||||
| 2007 [2] |
334 127 |
38% |
12426 4729 [2] |
||||||||||||||||||||||
| Jan08 |
9 3 |
53 31 |
17 10 |
7 5 |
98 80 |
35 21 |
23 7 |
40 12 |
1130 32 |
9 6 |
29 14 |
71 40 |
12 5 |
54 13 |
81 52 |
46 21 |
66 57 |
53 23 |
1833 432 |
||||||
| Feb08 |
68 32 |
1012 85 |
1660 416 |
||||||||||||||||||||||
| Mar08 |
61 28 |
959 140 |
1761 619 |
||||||||||||||||||||||
| Apr08 |
43 21 |
1028 145 |
1708 491 |
||||||||||||||||||||||
| May08 |
0 0 |
909 149 |
1538 477 |
||||||||||||||||||||||
| Jun08 |
0 0 |
602 119 |
1360 449 |
||||||||||||||||||||||
| Jul08 |
15 0 |
565 215 |
19 4 |
15 12 |
64 41 |
60 25 |
12 4 |
52 8 |
814 121 |
14 4 |
48 24 |
64 35 |
40 6 |
52 21 |
59 26 |
46 13 |
48 26 |
64 28 |
2051 613 |
||||||
| Aug08 |
713 270 |
865 113 |
2316 730 |
||||||||||||||||||||||
| Sep08 |
459 192 |
781 170 |
1926 712 |
||||||||||||||||||||||
| Oct08 |
463 228 |
744 178 |
1952 854 |
||||||||||||||||||||||
| Nov08 |
515 268 |
602 131 |
1793 841 |
||||||||||||||||||||||
| Dec08 |
573 273 |
709 140 |
1786 741 |
||||||||||||||||||||||
| 2008 [2] |
3513 1558 |
10155 1523 |
34% |
21684 7375 [2] |
|||||||||||||||||||||
| Jan09 |
16 4 |
480 284 |
15 7 |
6 3 |
41 27 |
45 38 |
15 6 |
36 19 |
504 94 |
8 4 |
16 13 |
58 28 |
26 13 |
7 3 |
35 18 |
48 41 |
37 27 |
62 29 |
1455 658 |
||||||
| Feb09 |
389 207 |
274 88 |
1093 542 |
||||||||||||||||||||||
| Mar09 |
454 187 |
323 101 |
1270 563 |
||||||||||||||||||||||
| Apr09 |
513 170 |
327 69 |
1333 481 |
||||||||||||||||||||||
| May09 |
496 186 |
281 92 |
1274 509 |
||||||||||||||||||||||
| Jun09 |
467 158 |
272 66 |
1222 453 |
||||||||||||||||||||||
| Jul09 [7] |
3 1 |
152 56 |
14 8 |
13 8 |
55 31 |
38 18 |
20 5 |
53 22 |
320 95 |
6 1 |
22 7 |
46 28 |
13 8 |
27 12 |
23 5 |
19 11 |
55 39 |
53 20 |
931 375 |
||||||
| Aug09 |
96 33 |
281 85 |
867 370 |
||||||||||||||||||||||
| Sep09 |
88 24 |
827 367 |
|||||||||||||||||||||||
| Oct09 |
56 18 |
853 401 |
|||||||||||||||||||||||
| Nov09 |
69 17 |
795 350 |
|||||||||||||||||||||||
| Dec09 |
80 26 |
830 431 |
|||||||||||||||||||||||
| 2009 [2] |
3340 1366 |
43% |
12750 5500 [2] |
||||||||||||||||||||||
| Jan10 |
76 28 |
689 325 |
|||||||||||||||||||||||
| Feb10 |
70 22 |
699 365 |
|||||||||||||||||||||||
| Mar10 |
76 27 |
844 426 |
|||||||||||||||||||||||
| Apr10 |
83 27 |
837 388 |
|||||||||||||||||||||||
| May10 |
88 17 |
909 382 |
|||||||||||||||||||||||
| Jun10 |
99 29 |
783 336 |
|||||||||||||||||||||||
| Jul10 |
103 35 |
794 360 |
|||||||||||||||||||||||
| Aug10 |
100 28 |
873 411 |
|||||||||||||||||||||||
| Sep10 |
66 9 |
805 347 |
|||||||||||||||||||||||
| Oct10 |
74 24 |
762 375 |
|||||||||||||||||||||||
| Nov10 |
10 6 |
47 15 |
13 8 |
10 4 |
55 44 |
25 16 |
35 17 |
38 17 |
124 63 |
6 6 |
14 6 |
49 26 |
33 22 |
15 8 |
23 16 |
35 22 |
38 27 |
48 19 |
618 342 |
||||||
| Dec10 |
72 24 |
205 74 |
666 337 |
||||||||||||||||||||||
| 2010 [2] |
954 285 |
47% |
9279 4394 [2] |
||||||||||||||||||||||
| Jan11 |
73 21 |
247 105 |
$43 |
750 402 |
|||||||||||||||||||||
| Feb11 |
62 13 |
234 66 |
683 317 |
||||||||||||||||||||||
| Mar11 |
81 25 |
252 84 |
779 375 |
||||||||||||||||||||||
| Apr11 |
95 29 |
25 85 |
786 366 |
||||||||||||||||||||||
| May11 |
49 14 |
232 78 |
783 392 |
||||||||||||||||||||||
| Jun11 |
68 26 |
252 91 |
786 381 |
||||||||||||||||||||||
| Jul11 |
76 24 |
267 82 |
$38 |
815 348 |
|||||||||||||||||||||
| Aug11 |
76 24 |
285 85 |
959 426 |
||||||||||||||||||||||
| Sep11 |
64 14 |
242 113 |
814 424 |
||||||||||||||||||||||
| Oct11 |
3 1 |
24 0 |
19 10 |
6 4 |
72 50 |
24 21 |
35 18 |
47 23 |
801 124 |
11 7 |
18 10 |
53 31 |
35 24 |
20 10 |
50 35 |
40 20 |
42 36 |
46 26 |
1346 450 |
||||||
| Nov11 |
112 12 |
212 64 |
890 377 |
||||||||||||||||||||||
| Dec11 |
148 38 |
35 21 |
848 417 |
||||||||||||||||||||||
| 2011 [2] |
928 240 |
3084 998 |
46% |
10239 4678 [2] |
|||||||||||||||||||||
| Cam # |
BRJO |
CATH |
FOVI |
JONB |
MA10 |
MALE |
MAMI |
MIDE |
MITG |
TGDA |
THSE |
VIMO |
VIOP [8] |
VIRA |
VITG |
VITP -01 |
VITP -03 |
VIVA |
|
|
|||||
| Jan12 |
14 5 |
139 48 |
18 5 |
19 5 |
73 44 |
12 7 |
17 8 |
97 25 |
40 29 |
9 0 |
25 13 |
31 16 |
37 27 |
37 20 |
49 29 |
38 17 |
41 31 |
64 22 |
760 351 |
||||||
| Feb12 |
11 7 |
183 66 |
54 4 |
19 8 |
53 35 |
30 17 |
35 10 |
81 31 |
66 34 |
9 2 |
25 14 |
24 13 |
32 15 |
40 17 |
43 22 |
36 22 |
36 33 |
47 18 |
824 368 |
||||||
| Mar12 |
19 7 |
152 40 |
32 4 |
14 10 |
23 13 |
21 12 |
24 8 |
93 25 |
75 47 |
15 5 |
31 17 |
33 18 |
16 6 |
35 16 |
55 29 |
52 32 |
59 43 |
62 21 |
811 353 |
||||||
| Apr12 |
22 6 |
173 35 |
26 4 |
27 12 |
0 0 |
25 17 |
39 8 |
91 21 |
77 40 |
12 2 |
32 22 |
31 11 |
21 7 |
45 16 |
39 15 |
37 20 |
38 23 |
72 22 |
807 281 |
||||||
| May12 |
28 5 |
172 48 |
51 5 |
26 16 |
0 0 |
31 17 |
44 17 |
88 25 |
62 30 |
17 3 |
36 27 |
40 24 |
32 12 |
34 22 |
45 23 |
39 19 |
40 24 |
66 26 |
853 343 |
||||||
| Jun12 |
17 7 |
203 32 |
6 1 |
19 10 |
0 0 |
27 13 |
45 13 |
99 33 |
57 30 |
6 2 |
61 38 |
44 20 |
26 15 |
43 17 |
39 21 |
41 19 |
51 33 |
79 22 |
863 326 |
||||||
| Jul12 |
10 4 |
206 62 |
13 2 |
16 9 |
54 28 |
28 9 |
44 12 |
79 23 |
57 31 |
24 3 |
36 26 |
22 13 |
24 10 |
38 21 |
36 23 |
33 21 |
46 33 |
68 26 |
834 356 |
||||||
| Aug12 |
16 3 |
180 54 |
18 4 |
17 9 |
78 45 |
36 19 |
35 14 |
98 19 |
58 33 |
12 4 |
43 27 |
45 19 |
21 9 |
46 27 |
51 21 |
38 24 |
67 48 |
80 33 |
939 412 |
||||||
| Sep12 |
18 11 |
172 47 |
35 2 |
20 3 |
52 27 |
32 13 |
45 20 |
97 32 |
56 31 |
21 5 |
23 18 |
42 25 |
26 10 |
38 15 |
71 43 |
40 24 |
56 38 |
66 28 |
910 392 |
||||||
| Oct12 |
24 11 |
179 51 |
6 4 |
36 15 |
48 26 |
37 25 |
39 18 |
91 29 |
82 37 |
11 4 |
35 21 |
31 15 |
36 21 |
43 22 |
30 18 |
60 41 |
63 41 |
55 17 |
906 416 |
||||||
| Nov12 |
15 5 |
173 40 |
7 6 |
40 24 |
34 26 |
30 14 |
36 12 |
74 20 |
55 31 |
7 2 |
29 22 |
40 23 |
25 17 |
45 14 |
44 24 |
55 33 |
47 37 |
77 28 |
833 378 |
||||||
| Dec12 |
12 8 |
159 42 |
6 3 |
29 18 |
32 23 |
15 4 |
51 19 |
83 28 |
44 26 |
9 0 |
36 28 |
31 14 |
28 11 |
44 24 |
37 20 |
36 20 |
46 38 |
59 20 |
757 346 |
||||||
| 2012 [2] |
206 79 |
2091 565 |
272 44 |
282 139 |
447 267 |
324 167 |
454 159 |
1071 311 |
729 399 |
152 32 |
414 273 |
414 211 |
324 160 |
488 231 |
539 288 |
505 292 |
590 422 |
795 283 |
43% |
10097 4322 [2] |
|||||
| Jan13 |
150 41 |
$46 |
782 309 |
||||||||||||||||||||||
| Feb13 |
155 61 |
776 331 |
|||||||||||||||||||||||
| Mar13 |
172 76 |
857 418 |
|||||||||||||||||||||||
| Apr13 |
171 69 |
822 402 |
|||||||||||||||||||||||
| May13 [8] |
11 6 |
179 65 |
7 3 |
13 4 |
65 38 |
16 10 |
29 8 |
79 44 |
65 36 |
5 1 |
21 16 |
35 19 |
25 14 |
45 23 |
34 15 |
62 49 |
38 21 |
74 39 |
803 411 |
||||||
| Jun13 [8] |
15 8 |
176 55 |
4 2 |
28 13 |
56 39 |
23 11 |
26 7 |
95 46 |
67 41 |
9 4 |
27 22 |
62 41 |
40 23 |
50 26 |
27 14 |
37 25 |
37 20 |
62 37 |
841 434 |
||||||
| Jul13 |
16 4 |
195 50 |
3 1 |
17 7 |
59 42 |
47 29 |
35 9 |
102 40 |
70 43 |
12 4 |
32 23 |
54 33 |
29 14 |
42 14 |
9 6 |
46 36 |
34 16 |
76 28 |
$42 |
878 399 |
|||||
| Aug13 [8] |
12 0 |
200 63 |
13 3 |
21 11 |
127 82 |
45 21 |
35 7 |
100 52 |
87 48 |
15 4 |
51 37 |
61 39 |
31 11 |
43 21 |
25 12 |
48 35 |
70 47 |
73 34 |
1057 527 |
||||||
| Sep13 [8] |
16 6 |
179 43 |
6 2 |
14 7 |
136 67 |
59 23 |
40 7 |
91 46 |
71 42 |
13 4 |
42 31 |
73 41 |
18 11 |
50 20 |
102 57 |
65 58 |
53 39 |
61 22 |
1089 526 |
||||||
| Oct13 |
17 8 |
160 40 |
6 2 |
14 4 |
162 120 |
44 23 |
45 8 |
94 40 |
96 69 |
10 4 |
36 24 |
87 52 |
31 13 |
65 20 |
72 40 |
41 30 |
85 70 |
55 17 |
1120 584 |
||||||
| Nov13 [8] |
15 7 |
141 32 |
6 2 |
20 12 |
130 100 |
36 21 |
40 11 |
74 34 |
77 33 |
10 2 |
28 21 |
70 43 |
20 13 |
43 19 |
85 43 |
46 42 |
58 43 |
82 41 |
981 529 |
||||||
| Dec13 [8] |
11 1 |
108 17 |
2 0 |
15 7 |
150 117 |
36 13 |
46 8 |
100 50 |
68 36 |
8 0 |
41 21 |
66 40 |
0 0 |
46 15 |
80 37 |
48 40 |
59 46 |
62 29 |
946 477 |
||||||
| 2013 [1] |
179 64 |
1986 612 |
78 20 |
199 93 |
1043 721 |
418 199 |
436 110 |
1068 477 |
864 485 |
132 38 |
429 288 |
642 371 |
296 145 |
562 233 |
633 314 |
550 407 |
621 433 |
816 337 |
49% |
10952 5347 |
4820 1346 |
||||
| Jan14 |
143 41 |
0 0 |
$58 |
948 510 |
|||||||||||||||||||||
| Feb14 |
159 35 |
16 4 |
$57 |
918 455 |
|||||||||||||||||||||
| Mar14 |
17 2 |
237 58 |
5 0 |
28 5 |
134 91 |
25 12 |
35 5 |
97 44 |
93 50 |
7 3 |
78 46 |
87 37 |
6 2 |
31 12 |
88 49 |
61 51 |
65 46 |
78 37 |
$57 |
1172 550 |
|||||
| Apr14 |
200 53 |
1158 564 |
|||||||||||||||||||||||
| May14 |
193 67 |
1145 564 |
|||||||||||||||||||||||
| Jun14 |
202 62 |
1052 548 |
|||||||||||||||||||||||
| Jul14 |
194 59 |
1045 528 |
|||||||||||||||||||||||
| Aug14 |
17 9 |
205 60 |
3 0 |
24 16 |
163 116 |
43 22 |
44 4 |
126 66 |
81 42 |
15 4 |
51 38 |
96 57 |
28 12 |
60 20 |
50 24 |
64 48 |
71 45 |
81 35 |
1222 617 |
||||||
| Sep14 |
113 26 |
1135 542 |
|||||||||||||||||||||||
| Oct14 |
146 47 |
1174 520 |
|||||||||||||||||||||||
| Nov14 |
185 50 |
927 444 |
|||||||||||||||||||||||
| Dec14 |
200 35 |
1021 432 |
|||||||||||||||||||||||
| 2014 [1] |
229 77 |
2177 593 |
55 3 |
249 117 |
1712 1204 |
469 204 |
548 64 |
1161 578 |
969 558 |
82 25 |
616 410 |
1013 524 |
217 93 |
543 186 |
874 400 |
576 431 |
651 450 |
873 357 |
46% |
12924 6274 |
5711 3049 |
||||
| Jan15 |
13 5 |
217 63 |
4 0 |
24 18 |
77 58 |
35 19 |
34 10 |
104 56 |
77 52 |
6 3 |
39 30 |
86 47 |
12 5 |
28 12 |
99 48 |
35 27 |
58 49 |
77 42 |
$47 |
1025 544 |
|||||
| Feb15 |
15 5 |
181 57 |
17 0 |
27 16 |
68 51 |
44 31 |
40 19 |
87 35 |
63 49 |
11 6 |
35 20 |
69 34 |
17 10 |
48 21 |
72 44 |
46 35 |
55 43 |
69 29 |
964 505 |
||||||
| Mar15 |
16 9 |
217 79 |
6 2 |
12 10 |
76 54 |
39 22 |
25 11 |
76 39 |
76 40 |
14 9 |
31 21 |
64 35 |
17 7 |
39 18 |
84 45 |
30 25 |
49 37 |
60 27 |
931 490 |
||||||
| Apr15 |
10 10 |
223 85 |
10 0 |
14 7 |
122 84 |
37 18 |
28 7 |
79 46 |
62 34 |
14 9 |
23 14 |
69 47 |
13 8 |
41 20 |
59 27 |
32 23 |
81 64 |
58 25 |
975 528 |
||||||
| May15 |
17 11 |
216 86 |
10 3 |
22 12 |
126 85 |
32 20 |
28 6 |
96 55 |
69 39 |
11 6 |
36 20 |
56 27 |
15 8 |
42 17 |
63 29 |
25 19 |
55 39 |
39 24 |
958 506 |
||||||
| Jun15 |
14 8 |
246 127 |
6 3 |
10 6 |
158 115 |
38 21 |
28 5 |
90 57 |
70 43 |
10 5 |
34 27 |
52 24 |
25 16 |
45 18 |
45 28 |
17 12 |
52 29 |
21 9 |
961 553 |
||||||
| Jul15 |
15 8 |
253 103 |
10 7 |
19 9 |
163 117 |
44 23 |
23 7 |
83 55 |
84 40 |
9 5 |
34 27 |
54 30 |
24 13 |
46 23 |
42 19 |
12 9 |
45 24 |
29 12 |
$54 |
989 531 |
|||||
| Aug15 |
17 9 |
241 92 |
2 1 |
17 11 |
174 112 |
48 25 |
45 8 |
93 55 |
76 33 |
17 7 |
68 49 |
63 32 |
35 19 |
59 20 |
85 48 |
24 13 |
79 46 |
30 12 |
1173 592 |
||||||
| Sep15 |
23 13 |
213 79 |
5 4 |
17 10 |
162 89 |
51 25 |
32 9 |
114 63 |
101 66 |
16 10 |
56 29 |
70 31 |
24 10 |
45 14 |
94 51 |
33 19 |
64 41 |
38 16 |
1158 579 |
||||||
| Oct15 |
26 10 |
244 123 |
4 1 |
29 15 |
151 113 |
49 32 |
28 21 |
114 73 |
105 67 |
16 11 |
55 35 |
67 30 |
31 15 |
56 23 |
92 49 |
51 32 |
60 36 |
33 14 |
$58 |
1211 700 |
|||||
| Nov15 |
13 8 |
257 122 |
15 9 |
36 24 |
155 122 |
38 25 |
14 5 |
94 59 |
95 67 |
17 14 |
39 30 |
57 25 |
27 15 |
49 27 |
56 35 |
61 40 |
69 55 |
51 18 |
1143 700 |
||||||
| Dec15 |
13 9 |
252 119 |
7 6 |
24 13 |
130 107 |
35 17 |
45 26 |
95 56 |
81 61 |
8 3 |
55 37 |
57 21 |
18 8 |
44 26 |
42 25 |
68 42 |
74 55 |
52 23 |
1100 654 |
||||||
| 2015 [2] |
192 105 |
2760 1135 |
96 36 |
251 151 |
1562 1107 |
490 278 |
370 134 |
1125 649 |
959 591 |
149 88 |
505 339 |
764 383 |
258 134 |
542 239 |
833 448 |
434 296 |
741 518 |
557 251 |
55% |
12588 6882 |
6219 1998 |
||||
| Jan16 |
22 14 |
199 68 |
8 5 |
28 13 |
75 57 |
46 35 |
31 13 |
86 50 |
83 54 |
7 3 |
34 26 |
60 30 |
24 13 |
35 21 |
84 61 |
60 35 |
51 27 |
38 14 |
$66 |
971 539 |
|||||
| Feb16 |
18 7 |
249 112 |
11 8 |
29 14 |
154 114 |
43 25 |
20 13 |
71 40 |
88 50 |
10 4 |
32 15 |
73 44 |
20 11 |
48 33 |
73 41 |
74 46 |
61 42 |
75 27 |
1149 646 |
||||||
| Mar16 |
35 20 |
237 105 |
8 6 |
23 17 |
161 102 |
54 35 |
26 16 |
115 72 |
66 41 |
12 7 |
45 27 |
69 46 |
21 11 |
55 33 |
78 55 |
58 38 |
76 54 |
57 19 |
1196 704 |
||||||
| Apr16 |
11 8 |
256 102 |
12 6 |
29 17 |
164 101 |
45 31 |
38 23 |
77 38 |
87 54 |
5 1 |
48 28 |
77 51 |
25 14 |
59 28 |
101 62 |
63 37 |
69 38 |
38 16 |
$66 |
1204 655 |
|||||
| May16 |
23 18 |
244 110 |
13 7 |
27 11 |
158 109 |
36 23 |
25 11 |
93 57 |
103 71 |
15 4 |
52 25 |
80 48 |
30 13 |
37 22 |
85 54 |
62 40 |
76 45 |
30 11 |
1189 679 |
||||||
| Jun16 |
24 16 |
252 98 |
10 5 |
23 13 |
239 158 |
88 33 |
36 18 |
91 42 |
79 52 |
6 1 |
56 34 |
64 40 |
34 19 |
54 31 |
52 35 |
55 28 |
99 52 |
49 27 |
1311 702 |
||||||
| Jul16 |
24 13 |
324 153 |
10 7 |
36 16 |
218 123 |
85 36 |
37 20 |
86 41 |
94 58 |
14 3 |
57 31 |
57 35 |
39 23 |
37 12 |
51 33 |
71 34 |
211 115 |
46 19 |
|
1497 772 |
|||||
| Aug16 |
19 16 |
272 110 |
7 5 |
40 25 |
223 136 |
68 37 |
43 26 |
93 56 |
105 61 |
13 7 |
90 57 |
78 49 |
45 30 |
61 24 |
84 59 |
80 42 |
230 120 |
68 30 |
1619 890 |
||||||
| Sep16 |
28 16 |
290 128 |
8 5 |
34 25 |
186 115 |
84 47 |
43 27 |
81 42 |
108 54 |
10 7 |
60 35 |
55 37 |
28 14 |
52 14 |
81 44 |
85 59 |
248 154 |
74 28 |
1555 851 |
||||||
| Oct16 |
29 21 |
285 118 |
14 8 |
36 22 |
193 129 |
64 34 |
39 26 |
87 51 |
135 74 |
20 10 |
26 15 |
56 32 |
35 21 |
46 17 |
109 54 |
70 36 |
184 120 |
66 18 |
$79 |
1494 806 |
|||||
| Nov16 |
18 7 |
256 112 |
10 6 |
23 11 |
185 128 |
65 34 |
38 22 |
84 46 |
105 61 |
10 6 |
39 23 |
68 36 |
34 20 |
42 24 |
92 53 |
66 40 |
204 133 |
54 20 |
|
|
$68 |
1393 782 |
|||
| Dec16 |
22 16 |
241 94 |
12 9 |
38 19 |
156 107 |
61 33 |
37 23 |
99 60 |
65 42 |
7 5 |
44 24 |
46 29 |
43 27 |
28 13 |
48 31 |
44 33 |
177 113 |
59 31 |
1227 709 |
||||||
| 2016 [2] |
273 172 |
3105 1310 |
123 77 |
366 203 |
2112 1379 |
739 403 |
413 238 |
1063 595 |
1118 672 |
129 58 |
583 340 |
783 477 |
378 216 |
554 272 |
938 582 |
788 468 |
1686 1013 |
654 260 |
55% |
15805 8735 |
7924 4415 |
||||
| Cam # |
BRJO |
CATH |
FOVI |
JONB |
MA10 |
MALE |
MAMI |
MIDE |
MITG |
TGDA |
THSE |
VIMO |
VIOP |
VIRA |
VITG |
VITP -01 |
VITP -03 |
VIVA |
[9] |
[9] |
[9] |
|
|||
| Jan17 |
20 11 |
239 90 |
9 3 |
34 18 |
139 97 |
39 17 |
29 19 |
59 28 |
80 50 |
11 4 |
33 20 |
55 37 |
33 19 |
24 12 |
92 60 |
60 36 |
131 93 |
39 14 |
$82 |
1126 628 |
|||||
| Feb17 |
14 10 |
211 99 |
9 6 |
35 16 |
154 109 |
30 17 |
37 26 |
56 28 |
72 44 |
11 2 |
29 18 |
60 33 |
24 11 |
31 14 |
68 44 |
90 59 |
170 98 |
56 20 |
1157 654 |
||||||
| Mar17 |
37 24 |
299 109 |
17 7 |
32 20 |
212 131 |
68 38 |
35 18 |
59 41 |
110 62 |
13 6 |
41 26 |
54 37 |
42 31 |
30 14 |
67 45 |
69 42 |
213 135 |
47 21 |
1445 807 |
||||||
| Apr17 |
25 18 |
318 141 |
6 2 |
35 23 |
219 146 |
52 30 |
39 25 |
73 46 |
102 66 |
11 3 |
38 22 |
58 42 |
38 27 |
25 11 |
70 23 |
52 37 |
187 126 |
60 32 |
$73 |
1408 821 |
|||||
| May17 |
26 16 |
226 115 |
8 7 |
12 8 |
216 147 |
59 39 |
32 12 |
57 34 |
113 64 |
14 6 |
40 26 |
38 24 |
31 23 |
16 7 |
39 20 |
75 46 |
76 44 |
41 14 |
1119 652 |
||||||
| Jun17 |
22 16 |
305 141 |
8 8 |
31 20 |
199 137 |
48 20 |
31 23 |
77 41 |
78 51 |
16 3 |
57 32 |
84 55 |
46 26 |
64 35 |
67 43 |
39 26 |
218 119 |
50 23 |
1440 819 |
||||||
| Jul17 |
29 17 |
325 148 |
12 9 |
36 24 |
201 111 |
61 36 |
36 20 |
53 29 |
80 40 |
13 8 |
47 25 |
83 51 |
40 27 |
47 21 |
68 41 |
32 17 |
161 81 |
55 20 |
|
$82 |
1379 725 |
||||
| Aug17 |
27 19 |
341 141 |
12 10 |
41 26 |
236 162 |
59 36 |
54 34 |
91 47 |
91 41 |
15 8 |
72 43 |
93 67 |
51 31 |
63 28 |
110 67 |
82 47 |
225 145 |
52 23 |
|
1715 975 |
|||||
| Sep17 |
29 19 |
294 117 |
13 5 |
31 19 |
165 115 |
48 38 |
46 32 |
94 56 |
57 31 |
19 8 |
122 84 |
88 50 |
51 34 |
58 23 |
124 73 |
57 38 |
244 168 |
50 22 |
1590 932 |
||||||
| Oct17 |
28 22 |
297 137 |
9 5 |
33 16 |
201 134 |
39 27 |
44 25 |
81 46 |
105 53 |
20 9 |
92 57 |
80 54 |
66 36 |
67 30 |
97 60 |
81 51 |
231 171 |
53 23 |
$97 |
1624 956 |
|||||
| Nov17 |
22 7 |
157 60 |
8 5 |
43 25 |
166 116 |
52 32 |
42 18 |
96 43 |
117 60 |
8 5 |
127 88 |
76 53 |
64 36 |
45 21 |
79 41 |
56 35 |
220 162 |
52 13 |
1430 820 |
||||||
| Dec17 |
38 17 |
265 98 |
6 5 |
32 21 |
190 136 |
54 36 |
50 27 |
96 54 |
92 54 |
16 12 |
126 78 |
53 27 |
42 24 |
44 17 |
98 53 |
93 57 |
135 85 |
46 14 |
1476 815 |
||||||
| 2017 [2] |
317 196 |
3277 1396 |
117 72 |
395 236 |
2298 1541 |
609 366 |
475 279 |
892 493 |
1097 616 |
167 74 |
824 519 |
822 530 |
529 325 |
514 233 |
979 570 |
786 491 |
2211 1427 |
601 239 |
57% |
16909 9604 |
8983 5362 |
||||
| Jan18 |
33 18 |
235 95 |
14 10 |
29 19 |
149 92 |
56 24 |
44 25 |
95 50 |
88 55 |
17 7 |
124 75 |
40 23 |
38 17 |
30 14 |
216 124 |
94 46 |
79 50 |
41 15 |
$88 |
1422 759 |
|||||
| Feb18 |
26 16 |
312 135 |
18 11 |
32 22 |
187 123 |
44 26 |
42 26 |
95 53 |
102 54 |
22 12 |
127 83 |
47 30 |
34 21 |
33 18 |
162 107 |
101 65 |
90 63 |
56 24 |
$82 |
1530 889 |
|||||
| Mar18 |
39 22 |
293 170 |
14 12 |
38 24 |
175 120 |
61 44 |
41 29 |
80 60 |
78 58 |
22 10 |
109 72 |
49 35 |
33 19 |
37 18 |
210 150 |
148 99 |
275 201 |
64 36 |
$100 |
1766 1179 |
|||||
| Apr18 |
35 24 |
385 182 |
19 14 |
32 23 |
199 132 |
68 47 |
42 30 |
112 65 |
93 56 |
21 14 |
53 32 |
47 31 |
35 21 |
43 22 |
214 125 |
229 166 |
201 133 |
62 21 |
$118 |
1890 1138 |
|||||
| May18 |
46 29 |
383 214 |
7 4 |
34 26 |
195 126 |
64 47 |
44 27 |
126 84 |
103 71 |
20 14 |
40 32 |
44 35 |
58 34 |
47 24 |
206 142 |
196 143 |
143 100 |
57 33 |
1813 1185 |
||||||
| Jun18 |
39 31 |
289 190 |
15 11 |
37 27 |
156 115 |
56 33 |
45 24 |
107 63 |
73 50 |
18 12 |
57 47 |
40 28 |
55 30 |
34 18 |
144 105 |
160 119 |
143 90 |
51 27 |
1519 1020 |
||||||
| Jul18 |
30 20 |
129 87 |
21 14 |
24 18 |
237 152 |
58 37 |
38 26 |
92 57 |
78 53 |
10 6 |
56 36 |
38 28 |
49 34 |
46 23 |
145 91 |
139 111 |
151 96 |
56 29 |
$166(?) |
1397 918 |
|||||
| Aug18 |
27 16 |
139 90 |
6 4 |
28 16 |
221 147 |
73 50 |
62 32 |
127 82 |
112 81 |
24 15 |
76 57 |
46 34 |
80 59 |
59 28 |
171 120 |
211 152 |
221 173 |
58 31 |
1741 1187 |
||||||
| Sep18 |
20 9 |
121 77 |
24 16 |
20 13 |
177 105 |
74 52 |
41 26 |
93 59 |
109 70 |
14 10 |
51 33 |
42 30 |
58 42 |
45 18 |
211 150 |
193 128 |
199 143 |
64 25 |
1556 1006 |
||||||
| Oct18 |
41 23 |
161 97 |
19 11 |
26 17 |
205 120 |
2 1 |
58 36 |
98 61 |
97 67 |
23 11 |
40 30 |
23 18 |
64 40 |
34 17 |
235 169 |
229 163 |
206 152 |
81 37 |
1642 1070 |
||||||
| Nov18 |
29 16 |
98 60 |
9 6 |
15 9 |
202 135 |
58 27 |
55 34 |
92 51 |
87 56 |
12 8 |
46 31 |
0 0 |
52 33 |
61 22 |
195 140 |
208 147 |
191 135 |
48 26 |
1458 936 |
||||||
| Dec18 |
33 21 |
110 56 |
24 13 |
28 19 |
212 131 |
72 46 |
62 33 |
110 68 |
96 63 |
16 8 |
51 37 |
0 0 |
49 36 |
43 19 |
178 122 |
138 84 |
179 131 |
48 26 |
1449 913 |
||||||
| 2018 [2] |
398 245 |
2655 1453 |
190 126 |
343 233 |
2315 1498 |
686 434 |
574 348 |
1227 753 |
1116 734 |
219 127 |
830 565 |
416 292 |
605 386 |
512 241 |
2287 1545 |
2046 1423 |
2078 1467 |
686 330 |
WATCH OUT |
64% |
19183 12200 |
10805 7087 |
|||
| Jan19 |
94 44 |
1266 868 |
|||||||||||||||||||||||
| Feb19 |
98 52 |
1190 785 |
|||||||||||||||||||||||
| Mar19 |
169 101 |
1603 1035 |
|||||||||||||||||||||||
| Apr19 |
154 79 |
1433 909 |
|||||||||||||||||||||||
| May19 |
152 90 |
1396 934 |
|||||||||||||||||||||||
| Jun19 |
131 71 |
1186 731 |
|||||||||||||||||||||||
| Jul19 |
34 15 |
187 61 |
31 8 |
0 0 |
42 20 |
61 31 |
33 9 |
0 0 |
48 30 |
0 0 |
54 38 |
52 33 |
70 33 |
60 21 |
158 86 |
124 86 |
123 58 |
60 21 |
1137 530 |
||||||
| Aug19 |
162 86 |
1256 777 |
|||||||||||||||||||||||
| Sep19 |
0 0 |
131 70 |
19 12 |
0 0 |
12 7 |
48 35 |
36 16 |
7 5 |
0 0 |
0 0 |
52 36 |
62 42 |
90 54 |
39 18 |
299 195 |
168 117 |
168 114 |
60 28 |
1191 749 |
||||||
| Oct19 |
6 1 |
191 94 |
17 10 |
14 10 |
152 91 |
47 32 |
36 16 |
58 32 |
0 0 |
4 3 |
67 44 |
69 43 |
65 49 |
53 16 |
282 183 |
166 116 |
190 127 |
66 17 |
1483 884 |
||||||
| Nov19 |
157 83 |
|
|
1357 798 |
|||||||||||||||||||||
| Dec19 (calc.) [12] |
110 55 |
1301 844 |
|||||||||||||||||||||||
| 2019 [1] |
294 193 |
1736 886 |
210 111 |
200 141 |
1527 1017 |
612 431 |
450 240 |
632 368 |
674 438 |
134 79 |
580 386 |
456 303 |
817 565 |
552 242 |
2543 1740 |
1869 1268 |
1820 1165 |
693 271 |
WATCH OUT |
|
|
62% |
15799 9844 |
8083 5678 |
|
| Jan20 |
119 61 |
62% |
1239 766 |
||||||||||||||||||||||
| Feb20 |
169 76 |
58% |
1398 814 |
||||||||||||||||||||||
| Mar20 |
97 39 |
51% |
878 451 |
||||||||||||||||||||||
| Apr20 |
25 14 |
68 31 |
12 9 |
25 18 |
65 35 |
35 26 |
9 2 |
39 30 |
48 31 |
12 9 |
16 12 |
28 17 |
14 11 |
16 5 |
10 9 |
26 12 |
24 15 |
43 13 |
58% |
515 299 |
|||||
| May20 |
|||||||||||||||||||||||||
| Jun20 |
|||||||||||||||||||||||||
| 2020 |
|||||||||||||||||||||||||
| Cam # |
BRJO |
CATH |
FOVI |
JONB |
MA10 |
MALE |
MAMI |
MIDE |
MITG |
TGDA |
THSE |
VIMO |
VIOP |
VIRA |
VITG |
VITP -01 |
VITP -03 |
VIVA |
[9] |
[9] |
[9] |
|
|||
| Bris- tol @ John- son [6] [9] |
Calif. @ Thom- pson [6] [7] |
Foot- hill @ Vic- toria [6] |
John- son @ North- bank [6] |
Main @ 101 [6] |
Main @ Lemon Grove [6] |
Main @ Mills [6] |
Mills @ Dean [6] |
Mills @ Tele- graph [6] |
Tele- graph @ Day [6] [9] |
Thom- pson @ Sea- ward [6] |
Vic- toria @ Moon [6] |
Vic- toria @ Olivas Park [6] [8] |
Vic- toria @ Rals- ton [6] |
Vic- toria @ Tele- graph [6] |
Vic- toria Sbd @ Tele- phone [6] |
Tele- phone Ebd @ Vic- toria |
Vic- toria @ Valen- tine [6] |
Wells and Darling [9] |
Monthly Payment from the Court (thousands) [10] |
Total Notices Printed as % of Violations Recorded |
Total Pro- cessed/ Issued [1] |
Total Citations Issued/ Left Turn Citations Per CVC 21455.5(i) Annual Reports [11] |
Official reports, 2001 - Jul07
Official reports, Jan08 - Aug09
Official reports, Sep09 - Nov10
Official reports, Jan11 - Sep12
Official reports, Sep12 - Apr13
Official reports, Oct01 & May13 - Jan14 [8]
Official reports, 2001 - 2014
Official reports, 2001-2014 (more)
Official reports, 2003 - 2015
Official reports, 2015 Mid
Official reports, 2015 Late
Official reports, Feb15 & Early 2016
Official reports, 2007 & 2016 Spring
Official reports, 2016 Late
Official reports, 2016 - 2017
Official reports, Spring 2017
Official reports, 2017 - 2018
Official reports, Spring 2018
Official reports, Late 2018
Official reports, Dec. 2018 - Sep19
Official reports, Oct. - Nov. 2019 & 2019 Full Year
Official reports, Early 2020
[1] Totals are as provided by the City.
[2] These annual totals, or projections, are by highwayrobbery.net. The projections are based upon only the data shown in the table above.
[3] Un-used columns are to allow for later expansion of City's system.
[4] Except where noted otherwise, the figures given in the table are for the single calendar month indicated. Any figures in red type (or, if you are looking at this table in black and white, the upper figure when there are two or more figures in a cell) are what RedFlex calls Total Violations, or Total Processed Incidents, or all incidents recorded by the cameras. The figures in black type are what RedFlex calls Notices Printed, and represent the sum of genuine citations issued (those filed with the court) plus any Nominations mailed (not filed with the court, a.k.a. Snitch Tickets). Due to time limitations data may have been posted to the table only for selected months or locations. If there is sufficient public interest, the remaining months or locations will be posted. Full official data has been received and is available at one of the links given above.
[5] The official report for this month covered less than the full month, so we increased the official In Progress figure by the appropriate proportion of the first Sub Total Violations figure, then we increased the Approved Violations figure by the adjusted number of violations In Progress times the 55% issuance seen in 2016.
[6] The camera enforcement is believed to be on traffic on the first-named street, but the direction of enforcement (north, south, east, west, thru, left) is not yet available.
[7] See Set # 3, below.
[8] For an unknown reason, the reports received in Feb. 2014 did not include the VIOP camera. It may have been temporarily out of operation. Reports received later included VIOP.
[9] Two cameras are to be removed and up to three new camera locations may be coming, in 2020 or later. See Set # 2, below.
[10] See Docs Set # 7, below.
[11] From the annual reports required, beginning with 2013, by CVC 21455.5(i). They become available by the Fall of the following year. Also see Set # 5, below.
[12] No report was received for this month. The systemwide total for this month was calculated by subtracting the previous eleven months from the full year total.
Ventura's Contract with RedFlex
Ventura Once Owed RedFlex $2.7 Million
In Chronological Order
Former Contract, 2002
Ventura's former main contract of 2006 (staff report) with RedFlex was signed in May 2006 and included an illegal Cost Neutrality clause, whereby the city did not have to pay RedFlex the full monthly rent (the so-called "fixed fee") if the fine revenue wasn't sufficient to cover the cost. See Subsection B. of Defect # 10.
The 2006 contract did not require Ventura to ticket rolling rights, and the City chose - correctly - to give it very little emphasis. Because of the resulting low fine revenue (combined with the cost neutral terms), by late 2008 Ventura had paid RedFlex $1.7 million less than the cumulative "fixed fee." See the clause and the invoices here.
In Nov. 2008 the contract was amended to penalize the City should it choose not to enforce right-hand turn violations:
"5. Cost neutrality is guaranteed except as follows:
[If] The city fails to enforce right turn violations (from automated red light violations), in good faith and due diligence, if and when systems are configured for this purpose as mutually agreed between Redflex and the City."
In Jan. 2009 senior VPD personnel told me that the City's position was that it did not owe RedFlex the $1.7 million.
Invoices and other documents covering March 2013 showed that in that sample month the City received $36,865 in fines from the court, kept $20,472 to cover its "Customer Operating Costs" (per Exh. D of the contract) and paid the remaining $16,392 to RedFlex, which had billed the City $37,908 (18 cameras at $2106 each).
The one-third increase in ticketing which began in Aug. 2013 put more tickets "in the pipeline," thus gradually increased the City's monthly fine revenue to the point where the City was able to pay more to RedFlex. Invoices and other documents received in early 2014 showed that RedFlex was paid $37,111 for its services during the month of Jan. 2014, more than double what the company was paid the previous March, and much closer to the $39,424 the company began billing the City each month after a May 2013 price increase.
Despite the increase in ticketing, by Summer 2014 the City owed RedFlex an additional $1 million, for a grand total of $2.7 million.
2015: Up To Seven More Years - With a Quota?
The term of the 2008 (amended) contract ended/expired in Nov. 2013, after which it was allowed to continue on a month-to-month basis.
At a Sept. 2014 meeting the council was presented with a staff recommendation to extend the program for up to seven years, the last four of which would come from two automatic two-year extensions. The proposed new contract would have continued Cost Neutrality and kept the rent at $2190 per camera per month. It provided that RedFlex would write off $1.7 million of the $2.7 million debt.
The vote to accept the staff recommendation was a 3 - 3 tie (Ayes: Tracy, Monahan and Nasarenko, with Morehouse absent). After that, the council unanimously adopted a new motion which was to continue the month-to-month extensions of the old contract to allow staff some time to gather more information and prepare a new report.
Post-meeting Article
Up To Seven Year Contract OK'd at March 30, 2015 Council Meeting, with More Cameras - and a Quota?
Staff Report, Powerpoint Slides, and Draft Contract
Safer Streets LA Report
Letters by highwayrobbery.net
Contract as signed 4-2-15
At the March 30 meeting the council voted 6 - 1 (Nay: Heitmann) to accept a revised contract. The monthly rent remained the same ($2190 per camera), but the two two-year renewals were changed from automatic to optional.
Based upon the rent other cities pay - see FAQ # 17 - Ventura should not have agreed to pay more than $1500 per camera, or $27,000 per month for all 18 cameras.
Because it agreed to continue to pay $2190 for another seven years, the City will overpay by $1 million and will need to issue an extra 10,000 tickets to cover the overpayment.
The president of RedFlex was present at the meeting, and spoke.
The $2.7 million cost neutrality debt was fully forgiven (saving $1 million over the deal presented at the Sept. 2014 meeting) and replaced with a novel cost neutrality clause (Bakersfield and Citrus Heights have similar clauses) under which the term of the contract term will be extended one day for each $1314 the fine revenue falls short of paying RedFlex the full monthly rent of $39,424. (If this new quota-like clause were to be applied to the now-forgiven debt of $2.7 million, the extension would be 2055 days or 5.6 years.) Anticipating concerns about possible lengthy extensions, the staff report said:
"Redflex... will relocate three existing red light camera approaches..." and " ... once we move the 3 locations we anticipate revenue to increase and therefore the [potential] extension to decrease."
Here is a survey RedFlex did, to look at potential ticketing at possible new locations.
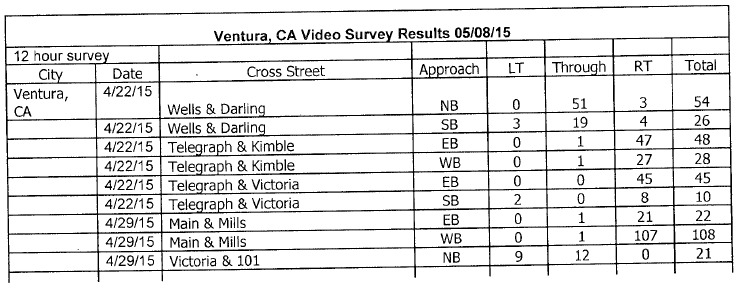
From 5-12-15 email RedFlex sent to City, obtained 12-19-16. The cut-off bottom is as received from the City.
The March 30 staff report also included this deceptive table.
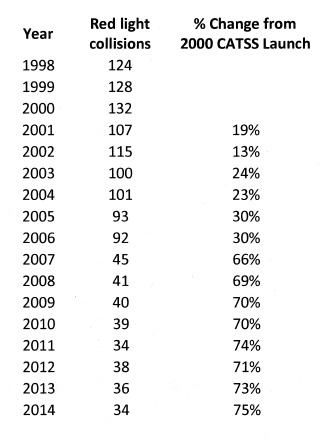
Image from pg. 4 of staff report prepared for 3-30-15 Ventura council meeting
The claimed reduction of accidents (down 75%), including a large change between 2006 and 2007, may be explained by this response staff made to questioning by Mayor Heitmann (at 3:20:20 on the video):
"The way the police department reports collisions now is vastly different than we did when we started this program. Now we only report - correct me if I'm wrong - now we only report injury or major property damage collisions. That's different. Our total collision numbers are down quite a bit because the reporting is different."
The new contract approved in 2015 did not include a Termination for Convenience ("escape") clause, so the City is locked in to the contract until it expires.
In Feb. 2017 the City agreed to extend the contract expiration date by 39 days (to May 2018) after a cost neutrality calculation showed that the City's payments to RedFlex had fallen $50,406.32 short of the amount billed.
In May 2018 the city council approved a two year extension, to 2020. The staff report included the same deceptive accident numbers that the staff presented to the council in 2015, except that they were displayed in the bar graph below instead of a table (shown above).
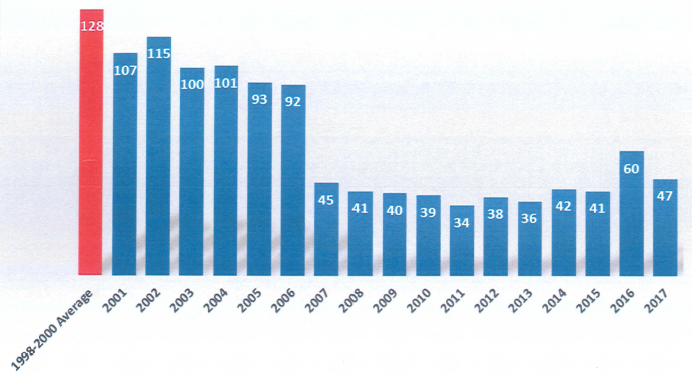
From staff report prepared for May 2018 Ventura council meeting
In Jan. 2020 we asked about the current cost neutrality status and the City replied:
"In response to the Cost Neutrality Reconciliation, the Cost Neutrality Reconciliation for FY 18-19 was completed and there are no outstanding balances. Because of this, no extensions need to be made to the existing agreement. We do not receive any documentation from RedFlex when the annual cost neutrality reconciliation results in no outstanding balances."
Sept. 21, 2020: 5th Try for Another Two-Year Extension
A staff report on the agenda for the May 18, 2020 city council meeting recommended another two-year extension, to 2022, and a number of motorists submitted written comments.
Four Letters in Opposition
The item was not heard on May 18th. Near the beginning of the meeting the mayor announced that it was being removed from that day's agenda and "continued" to a "date uncertain."
On June 3 the City Clerk's office told us that the item has been re-scheduled for the council meeting of July 13.
During the July 13 meeting (staff report) a number of Ventura residents spoke in opposition to the cameras. And six new opposition letters were submitted. After some
discussion the council asked staff to come back later with more info.
The new date was to be Aug. 3.
The staff report prepared for the Aug. 3 meeting was nearly identical to the one prepared for the July 13 meeting.
Early on Aug. 3 the City Clerk's office told us that the item was being removed from the Aug. 3 agenda and continued to a date uncertain.
The new date was to be Sept. 14.
The new staff report prepared for the Sept. 14 meeting no longer reported the dramatic reduction in traffic collisions claimed in the Aug. 3 report. It also revealed that the City refunded two tickets (out of 222) that were issued during a 2019 - 2020 period when the yellow light at Northbank and Johnson was set too short.
During the Sept. 14 meeting there was a problem with the sound during the red light camera item, so the mayor announced - during the meeting - that the contract renewal would be continued to the 28th, the next regular meeting. But on the afternoon of Sept. 17 they moved it up a week - they published an agenda calling a special meeting on
Monday, the 21st, where the cameras will be the sole subject. (The staff report is unchanged from the one prepared for Sept. 14.)
The pandemic restrictions on the size of public gatherings remain in effect, so it will be possible for you to address the council, live, from the comfort of your couch.
To see how much money the City has received from the Court, see Set # 7, below. The figures are also posted in a column in Set # 1, above.
This list of contracts and amendments was up-to-date as of 9-17-20.
Ventura Docs Set # 3
Two ( ! ) Grand Jury Reports (2009 and 2013)
2009 Report Recommends Longer Yellows
In June 2009 the Ventura County Grand Jury issued a report recommending the the yellow at the California/Thompson intersection be lengthened.
The Calif./Thompson ticket counts for July 2009 onward (see table above) show a reduced ticket volume, which will make it more difficult for the City to pay off the debt it owes RedFlex.
See article (including link to the 2009 report).
2013 Grand Jury Report Questions Validity of Tickets from Cameras, Discusses Removal
Some excerpts from the report:
"Also, increased time for the yellow turn arrows and delayed green lights would help the confusion at the Corridor traffic signals. Further, the Grand Jury recommends that traffic planners initiate the process to complete the connection from westbound Hwy 126 to the southbound Hwy 101. If these recommendations are not implemented, red light cameras along the Corridor should be removed."
"The Grand Jury found that red light camera tickets issued along the Corridor may be questioned as to their validity due to driver confusion. While the red light camera tickets appear to be legal, they may not be ethically or morally justified."
"The intersection at Victoria and Telephone Road appears to be the major intersection on this route that highlights the traffic flow problems along the Corridor. The Grand Jury found that the left turn lanes at this intersection have created many red light camera tickets."
The City was required to respond, and that response was discussed at the July 15, 2013 council meeting.
If you would like to read some grand jury reports from other counties, about their red light cameras, see the Grand Jury entry in the Site Index.
Ventura Docs Set # 4
"Late Time"
Bar Graphs
Until 2014, the City provided bar graphs of
Late Times, etcetera.
These graphs track violations recorded, not tickets
issued.
Where there is a large number of long Late Time
violations in a curb lane, it is believed to indicate
heavy ticketing on right turns.
(The curb lane will be the lane with the highest lane
number.)
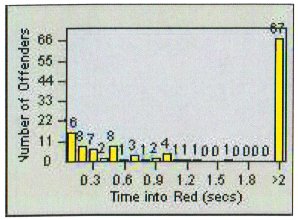
The picture above is an example from another
city.
Jul.
2002: BRJO - MITG
Jul.
2002: TGDA - VIVA
Jul.
2010: BRJO - MITG
Jul.
2010: TGDA - VIVA
Jul.
2012: BRJO - MITG
Jul.
2012: TGDA - VIVA
In 2014 Ventura stated that the
bar graphs are no longer available, but in May 2020 we
repeated our request for them.
An official report showed that in 2018, 66% of the City's tickets were for left turns.
Ventura Docs Set # 6
No More Info on City's Website
When the program first started the City had a lot of information posted on its website. But by 2011 the information was no longer available online as the link had become dead.
VPD Web Page as of 2015, with Dead Link
Ventura Docs Set # 7
How Much $$$ They Get
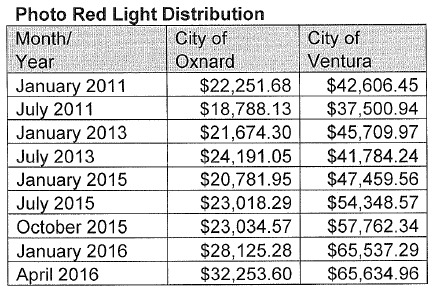
In May 2016 we asked the Ventura County Superior Court how much red light camera fine money Oxnard and the City of Ventura were getting, during selected months. Here is the table they sent.
The figures from this table have also been posted in a column in Set # 1, above.
In March 2017 the City of Ventura sent us documents showing the revenue during selected months in 2014 and 2016.
Those figures have also been posted in a column in Set # 1, above.
In Aug. 2018 the City sent us more documents showing revenue and expense in 2018.
In Sept. 2018 the Court sent us documents showing the City's revenue in 2016 - 2018. We have asked them to double check the $165,544 figure they reported for July 2018, as it seems too high for the quantity of tickets issued.
Most of those figures have also been posted in a column in Set # 1, above.
Ventura Docs Set # 8
More Coming
There may be some more information posted in the next few weeks. Mark your calendar to remind you to come back here and look!
---------------------------------
RED LIGHT CAMERAS
www.highwayrobbery.net
www.highwayrobbery.net