If
you haven't already done so, please read the
Home Page
Back
to the Culver City
Documents Main Page
This Page is
Culver City Documents -
Set # 13
New 9-3-04, updated 1-18-20
I. Ticket Counts
Watch Out - Big Intensification of Enforcement Beginning in 2016
[22] [31] [37]
Table 1: 2000 - 2004 Monthly Counts
Most cities demand, from their camera vendor, a monthly tabulation showing, among other things, how many tickets were issued that month at each intersection or "approach." Several times in 2004 I asked Culver City for a copy of their monthly intersection-by-intersection tabulations, but they never provided them (the first request is at: Culver City Documents Set # 1). They did provide some overall totals of tickets issued and collected, and that information is below.
Footnotes are indicated by brackets ( ).
| Jeff EB@ Cota |
Jeff WB@ Cota |
Jeff EB@ Duq- uesne |
Jeff WB@ Duq- uesne |
Sla- uson EB@ Buck |
Sla- uson WB@ Buck |
Wash WB@ Beet |
Wash EB@ Beet |
La Cien NB@ Wash |
La Cien SB@ Wash |
Sep NB@ GVC |
Sep SB@ GVC |
Sep NB@ Mach |
Sep SB@ Mach |
Cent NB@ Wash |
Cent @ Wash |
Sep Cent |
Jeff WB@ Over Left |
Jeff @ Over |
Wash EB@ Sawt |
Tic- kets Iss- ued (1) |
Tic- kets Paid (2) |
Nbr. of Appr Oper (3) |
||
| Jan00 |
|
|
|
|
|
|
|
|
|
|
|
|
|
|
|
|
|
|
|
|
|
343 |
|
|
| Feb00 |
|
|
|
|
|
|
|
|
|
|
|
|
|
|
|
|
|
|
|
|
|
828 |
|
|
| Mar00 |
|
|
|
|
|
|
|
|
|
|
|
|
|
|
|
|
|
|
|
|
|
1253 |
|
|
| Apr00 |
|
|
|
|
|
|
|
|
|
|
|
|
|
|
|
|
|
|
|
|
|
1128 |
|
|
| May00 |
|
|
|
|
|
|
|
|
|
|
|
|
|
|
|
|
|
|
|
|
|
1204 |
|
|
| Jun00 |
|
|
|
|
|
|
|
|
|
|
|
|
|
|
|
|
|
|
|
|
|
1370 |
|
|
| Jul00 |
|
|
|
|
|
|
|
|
|
|
|
|
|
|
|
|
|
|
|
|
|
1658 |
|
|
| Aug00 |
|
|
|
|
|
|
|
|
|
|
|
|
|
|
|
|
|
|
|
|
|
1378 |
|
|
| Sep00 |
|
|
|
|
|
|
|
|
|
|
|
|
|
|
|
|
|
|
|
|
|
1300 |
|
|
| Oct00 |
|
|
|
|
|
|
|
|
|
|
|
|
|
|
|
|
|
|
|
|
|
1058 |
|
|
| Nov00 |
|
|
|
|
|
|
|
|
|
|
|
|
|
|
|
|
|
|
|
|
|
994 |
|
|
| Dec00 |
|
|
|
|
|
|
|
|
|
|
|
|
|
|
|
|
|
|
|
|
|
1274 |
|
|
| Jan01 |
|
|
|
|
|
|
|
|
|
|
|
|
|
|
|
|
|
|
|
|
|
1125 |
|
|
| Feb01 |
|
|
|
|
|
|
|
|
|
|
|
|
|
|
|
|
|
|
|
|
|
1103 |
|
|
| Mar01 |
|
|
|
|
|
|
|
|
|
|
|
|
|
|
|
|
|
|
|
|
|
1789 |
|
|
| Apr01 |
|
|
|
|
|
|
|
|
|
|
|
|
|
|
|
|
|
|
|
|
|
1195 |
|
|
| May01 |
|
|
|
|
|
|
|
|
|
|
|
|
|
|
|
|
|
|
|
|
|
1389 |
|
|
| Jun01 |
|
|
|
|
|
|
|
|
|
|
|
|
|
|
|
|
|
|
|
|
|
1319 |
|
|
| Jul01 |
|
|
|
|
|
|
|
|
|
|
|
|
|
|
|
|
|
|
|
|
|
982 |
|
|
| Aug01 |
|
|
|
|
|
|
|
|
|
|
|
|
|
|
|
|
|
|
|
|
|
1146 |
|
|
| Sep01 |
|
|
|
|
|
|
|
|
|
|
|
|
|
|
|
|
|
|
|
|
|
1134 |
|
|
| Oct01 |
|
|
|
|
|
|
|
|
|
|
|
|
|
|
|
|
|
|
|
|
|
1124 |
|
|
| Nov01 |
|
|
|
|
|
|
|
|
|
|
|
|
|
|
|
|
|
|
|
|
|
1132 |
|
|
| Dec01 |
|
|
|
|
|
|
|
|
|
|
|
|
|
|
|
|
|
|
|
|
|
2020 |
|
|
| Jan02 |
|
|
|
|
|
|
|
|
|
|
|
|
|
|
|
|
|
|
|
|
|
959 |
664 |
15 |
| Feb02 |
|
|
|
|
|
|
|
|
|
|
|
|
|
|
|
|
|
|
|
|
|
814 |
554 |
15 |
| Mar02 |
|
|
|
|
|
|
|
|
|
|
|
|
|
|
|
|
|
|
|
|
|
917 |
842 |
15 |
| Apr02 |
|
|
|
|
|
|
|
|
|
|
|
|
|
|
|
|
|
|
|
|
|
734 |
803 |
15 |
| May02 |
|
|
|
|
|
|
|
|
|
|
|
|
|
|
|
|
|
|
|
|
|
868 |
607 |
15 |
| Jun02 |
|
|
|
|
|
|
|
|
|
|
|
|
|
|
|
|
|
|
|
|
|
663 |
663 |
15 |
| Jul02 |
|
|
|
|
|
|
|
|
|
|
|
|
|
|
|
|
|
|
|
|
|
916 |
636 |
15 |
| Aug02 |
|
|
|
|
|
|
|
|
|
|
|
|
|
|
|
|
|
|
|
|
|
1371 |
739 |
15 |
| Sep02 |
|
|
|
|
|
|
|
|
|
|
|
|
|
|
|
|
|
|
|
|
|
955 |
587 |
15 |
| Oct02 |
|
|
|
|
|
|
|
|
|
|
|
|
|
|
|
|
|
|
|
|
|
1334 |
685 |
15 |
| Nov02 |
|
|
|
|
|
|
|
|
|
|
|
|
|
|
|
|
|
|
|
|
|
1143 |
745 |
15 |
| Dec02 |
|
|
|
|
|
|
|
|
|
|
|
|
|
|
|
|
|
|
|
|
|
1168 |
666 |
15 |
| Jan03 |
|
|
|
|
|
|
|
|
|
|
|
|
|
|
|
|
|
|
|
|
|
1261 |
751 |
15 |
| Feb03 |
|
|
|
|
|
|
|
|
|
|
|
|
|
|
|
|
|
|
|
|
|
1000 |
827 |
15 |
| Mar03 |
|
|
|
|
|
|
|
|
|
|
|
|
|
|
|
|
|
|
|
|
|
1250 |
767 |
15 |
| Apr03 |
|
|
|
|
|
|
|
|
|
|
|
|
|
|
|
|
|
|
|
|
|
1307 |
751 |
15 |
| May03 |
|
|
|
|
|
|
|
|
|
|
|
|
|
|
|
|
|
|
|
|
|
1347 |
966 |
15 |
| Jun03 |
|
|
|
|
|
|
|
|
|
|
|
|
|
|
|
|
|
|
|
|
|
1536 |
816 |
15 |
| Jul03 |
|
|
|
|
|
|
|
|
|
|
|
|
|
|
|
|
|
|
|
|
|
1422 |
802 |
15 |
| Aug03 |
|
|
|
|
|
|
|
|
|
|
|
|
|
|
|
|
|
|
|
|
|
1653 |
1319 |
18 |
| Sep03 |
|
|
|
|
|
|
|
|
|
|
|
|
|
|
|
|
|
|
|
|
|
1542 |
852 |
19- |
| Oct03 |
|
|
|
|
|
|
|
|
|
|
|
|
|
|
|
|
|
|
|
|
|
1290 |
934 |
18 |
| Nov03 |
|
|
|
|
|
|
|
|
|
|
|
|
|
|
|
|
|
|
|
|
|
1355 |
926 |
18 |
| Dec03 |
|
|
|
|
|
|
|
|
|
|
|
|
|
|
|
|
|
|
|
|
|
1553 |
705 |
19 |
| Jan04 |
|
|
|
|
|
|
|
|
|
|
|
|
|
|
|
|
|
|
|
|
|
1286 |
805 |
20 |
| Feb04 |
|
|
|
|
|
|
|
|
|
|
|
|
|
|
|
|
|
|
|
|
|
1025 |
559 |
19 |
| Mar04 |
|
|
|
|
|
|
|
|
|
|
|
|
|
|
|
|
|
|
|
|
|
1082 |
939 |
14 |
| Apr04 |
|
|
|
|
|
|
|
|
|
|
|
|
|
|
|
|
|
|
|
|
|
1082 |
1040 |
|
| May04 |
|
|
|
|
|
|
|
|
|
|
|
|
|
|
|
|
|
|
|
|
|
1257 |
1052 |
|
| Jun04 |
|
|
|
|
|
|
|
|
|
|
|
|
|
|
|
|
|
|
|
|
|
1609 |
976 |
14 |
| Jul04 |
|
|
|
|
|
|
|
|
|
|
|
|
|
|
|
|
|
|
|
|
|
|
|
|
| Aug04 |
|
|
|
|
|
|
|
|
|
|
|
|
|
|
|
|
|
|
|
|
|
|
|
|
| Sep04 |
|
|
|
|
|
|
|
|
|
|
|
|
|
|
|
|
|
|
|
|
|
|
|
|
| Oct04 |
|
|
|
|
|
|
|
|
|
|
|
|
|
|
|
|
|
|
|
|
|
|
|
|
| Nov04 |
|
|
|
|
|
|
|
|
|
|
|
|
|
|
|
|
|
|
|
|
|
|
|
|
| Dec04 |
|
|
|
|
|
|
|
|
|
|
|
|
|
|
|
|
|
|
|
|
|
|
|
|
This table made by highwayrobbery.net, using official monthly tabulations and invoices. Any grand totals are as provided by the City.
Footnotes to the table:
(1) The figure for "Tickets Issued" comes from a monthly report which the police department provides to the city council. Samples of that report are reproduced in Culver City Documents Set # 1, pages 11 and 12.(2) The figure for "Tickets Paid" comes from a monthly memo (typically covering 30 days of activity, but ranging from 20 to 42 days) which the Automated Enforcement Section sends up the chain of command. Here is a recent example of that memo.
(3) The "Number of Approaches Operating" comes from a monthly invoice which RedFlex submits to the City. ("Approach" is camera industry terminology meaning camera enforcement against traffic moving in 1 compass direction at an intersection. An intersection could have up to four Approaches operating - although in most cities, including Culver City, they just have one or two.) Through February 2004 the invoices were detailed - they contained a list showing each intersection where there was a camera, and indicated the number of Approaches at that intersection. Beginning with March 2004 the invoices say only: "March 2004 - Intersection Service Fee $32,859.40." There is no list of the intersections. (The "detailed" invoices showed that the City paid RedFlex $2347.10 monthly for each Approach.)
Table 2: More Ticket Counts - 2003 - 2019 12-Month Totals (by Calendar Year and by Fiscal Year) and 2010 - 2019 Monthly Totals
| Cam # |
CEWA 01 |
CIWA 01 |
JECO 01 |
JEDU 01 |
JEDU 03 |
JEOV 03 |
NAWA 01 |
NAWA 03 |
OVWA 01 |
OVWA 03 |
SEGV 01 |
SEGV 03 |
SESL 01 |
SESL 03 |
SEWA 01 |
SEWA 03 |
SLBU 01 |
SLBU 03 |
WABE 01 |
WABE 03 |
WACE 01 |
WAHE 01 |
WAHE 03 |
WASA 01 |
[3] | A |
B |
C |
D |
E |
F |
||||||
| [6] |
Cen- tin- ela Nbd @ Wash- ing- ton Pl. |
La Cien- ega Nbd @ Wash- ing- ton |
Jef- fer- son Wbd @ Cota |
Jef- fer- son Wbd @ Du- que- sne |
Jef- fer- son Ebd @ Du- que- sne |
Jef- fer- son Ebd @ Over- land |
Nat- ional Xbd @ Wash- ing- ton |
Nat- ional Xbd @ Wash- ing- ton |
Sepul- veda Sbd @ Green Val- ley |
Sepul- veda Nbd @ Green Val- ley |
Sepul- veda Nbd @ Slau- son |
Sepul- veda Sbd @ Slau- son |
Sepul- veda Xbd @ Wash- ing- ton |
Sepul- veda Xbd @ Wash- ing- ton |
Slau- son Wbd @ Buck- ing- ham |
Slau- son Ebd @ Buck- ing- ham |
Wash- ing- ton Wbd @ Beet- ho- ven |
Wash- ing- ton Ebd @ Beet- ho- ven |
Wash- ing- ton Pl. Ebd @ Cen- tin- ela |
Wash- ing- ton Ebd @ Helms |
Wash- ing- ton Wbd @ Helms |
Wash- ing- ton Ebd @ Saw- telle |
Total Violations Recorded/ Notices Printed Per Official Monthly CMR Reports Excluding Six Cameras Added in 2017 [1] [4] |
Total Notices Printed as % of Vio- lations Re- corded All Cameras |
Total Vio- lations Re- corded/ Notices Printed All Cameras [1] [4] |
Total Cites per the CCPD Monthly Report [44] |
Total Citations Issued/ Rolling Right Citations Per CVC 21455.5(i) Annual Reports All Cameras [12] |
Revenue from Court (thou- sands) (17) |
|||||||||
| Jul03- Jun04 [9] |
990 632 |
0 |
0 |
0 |
0 |
1280 541 |
785 546 |
1689 1071 |
0 |
0 |
0 |
0 |
1777 1301 |
1767 1097 |
705 406 |
0 |
0 |
1722 1339 |
10715 6933 |
||||||||||||||||||
| Jul04- Jun05 [9] |
883 601 |
0 |
0 |
0 |
0 |
1921 956 |
2757 2364 |
4733 3368 |
0 |
0 |
0 |
0 |
2739 2136 |
2720 2037 |
856 486 |
0 |
0 |
837 614 |
17446 12562 |
||||||||||||||||||
| Jul05- Jun06 [9] |
915 464 |
0 |
0 |
0 |
0 |
2082 828 |
2873 2208 |
4453 2742 |
3866 2561 |
2795 1946 |
0 |
0 |
3208 2285 |
2853 1896 |
770 392 |
1281 1007 |
1097 918 |
1182 873 |
27375 18120 |
||||||||||||||||||
| Jul06- Jun07 [9] |
882 450 |
340 211 |
114 78 |
596 430 |
169 99 |
2650 1009 |
1879 1381 |
4753 2770 |
4848 3048 |
3259 2113 |
242 94 |
36 8 |
3010 2196 |
3000 2078 |
813 458 |
2221 1724 |
1736 1444 |
1081 751 |
31629 20342 |
||||||||||||||||||
| Jul07- Jun08 [9] |
1012 643 |
2674 1509 |
1851 1455 |
2431 1433 |
1507 893 |
3040 1725 |
1184 875 |
3705 2128 |
2954 1853 |
1647 1100 |
1377 527 |
430 141 |
2615 1995 |
2978 2119 |
722 438 |
1732 1418 |
1550 1302 |
791 590 |
34200 22144 |
||||||||||||||||||
| Jul08- Jun09 [9] |
798 559 |
2322 1531 |
1769 1380 |
2274 1600 |
1324 860 |
2240 1325 |
1127 888 |
2321 1664 |
1630 1078 |
1653 1114 |
835 332 |
530 299 |
2201 1700 |
2392 1736 |
778 518 |
1311 1025 |
1305 1106 |
1151 840 |
27961 19555 |
||||||||||||||||||
| Jul09- Jun10 [10] |
889 574 |
1404 888 |
1344 1049 |
2387 1677 |
1212 869 |
4414 3033 |
1115 869 |
3283 2421 |
2188 1582 |
1467 1045 |
1048 448 |
769 468 |
2279 1801 |
1854 1394 |
650 505 |
989 780 |
1021 879 |
1078 817 |
29391 21099 |
||||||||||||||||||
| Jul10- Jun11 [11] |
830 343 |
2033 1366 |
1419 1071 |
1839 1328 |
879 546 |
2569 1763 |
1810 852 |
3228 2433 |
2522 1693 |
1295 931 |
1925 754 |
882 475 |
1900 1410 |
1542 1141 |
461 280 |
769 555 |
1318 1156 |
1355 689 |
28576 18786 |
||||||||||||||||||
| 8-Year Totals (Jul03- Jun11) [2] |
7199 4266 |
8773 5505 |
6497 5033 |
9527 6468 |
5091 3267 |
20196 11180 |
13530 9983 |
28165 18597 |
18008 11815 |
12116 8249 |
5427 2155 |
2647 1391 |
19729 14824 |
19106 13498 |
5755 3483 |
8303 6509 |
8027 6805 |
9197 6513 |
207293 139541 |
||||||||||||||||||
| Jul11- Jun12 [17] |
727 158 |
2741 1501 |
1661 1177 |
2284 1354 |
532 289 |
914 496 |
456 279 |
355 238 |
1857 1394 |
705 308 |
4403 908 |
1024 508 |
2102 1421 |
1661 1228 |
819 217 |
420 267 |
1624 1375 |
1340 470 |
25625 13588 |
||||||||||||||||||
| Jul12- Jun13 [17] |
848 235 |
3372 1756 |
2400 1484 |
3087 1872 |
779 411 |
1135 643 |
1588 925 |
1134 793 |
2892 2042 |
1876 909 |
2972 1168 |
1089 565 |
2367 1693 |
2299 1756 |
1066 221 |
1039 629 |
1941 1578 |
1660 642 |
33544 19322 |
||||||||||||||||||
| Jul13- Jun14 [17] |
738 160 |
2589 1113 |
1946 1181 |
4018 2232 |
970 431 |
1130 643 |
2050 1343 |
1751 1267 |
4294 2808 |
3033 1627 |
3973 1272 |
1496 717 |
2327 1566 |
2634 1870 |
509 142 |
1059 704 |
2189 1656 |
1874 606 |
38400 21338 |
||||||||||||||||||
| Cam # |
CEWA 01 |
CIWA 01 |
JECO 01 |
JEDU 01 |
JEDU 03 |
JEOV 03 |
SEGV 01 |
SEGV 03 |
SESL 01 |
SESL 03 |
SLBU 01 |
SLBU 03 |
WABE 01 |
WABE 03 |
WACE 01 |
WAHE 01 |
WAHE 03 |
WASA 01 |
|||||||||||||||||||
| Jul10 [14] |
74 40 |
139 111 |
76 59 |
194 140 |
69 48 |
306 196 |
95 77 |
256 200 |
179 124 |
125 97 |
116 64 |
82 45 |
195 146 |
173 121 |
60 39 |
76 55 |
116 96 |
109 78 |
2440 1736 |
190 |
|||||||||||||||||
| Aug10 [14] |
75 40 |
139 105 |
93 69 |
152 117 |
79 54 |
297 192 |
112 97 |
316 239 |
198 129 |
127 92 |
108 63 |
88 47 |
181 132 |
245 185 |
51 39 |
83 67 |
79 69 |
76 48 |
2499 1784 |
217 |
|||||||||||||||||
| Sep10 [14] |
71 34 |
121 96 |
73 49 |
144 112 |
71 49 |
251 188 |
105 88 |
290 234 |
177 122 |
102 79 |
114 65 |
62 37 |
139 106 |
111 85 |
48 32 |
93 82 |
158 144 |
98 71 |
2228 1673 |
200 |
|||||||||||||||||
| Oct10 [14] |
69 38 |
110 80 |
74 58 |
178 137 |
81 61 |
301 235 |
108 81 |
313 247 |
172 126 |
110 74 |
93 57 |
58 34 |
183 147 |
168 123 |
45 33 |
76 66 |
170 147 |
56 46 |
2365 1790 |
177 |
|||||||||||||||||
| Nov10 [14] |
40 30 |
109 78 |
146 114 |
193 162 |
94 65 |
349 270 |
89 67 |
374 312 |
218 163 |
125 95 |
155 60 |
66 39 |
152 122 |
130 106 |
48 34 |
80 69 |
96 84 |
106 73 |
2570 1943 |
131 |
|||||||||||||||||
| Dec10 [14] |
112 32 |
153 99 |
216 165 |
240 168 |
122 68 |
366 239 |
259 118 |
437 330 |
283 177 |
227 166 |
249 72 |
94 46 |
199 150 |
151 118 |
48 21 |
82 73 |
80 72 |
162 84 |
3480 2198 |
162 |
|||||||||||||||||
| 2010 [23] |
858 473 |
1629 1152 |
1307 990 |
2255 1707 |
979 668 |
3663 2625 |
1336 962 |
3660 2800 |
2259 1581 |
1461 1036 |
1384 622 |
831 480 |
2061 1594 |
1945 1464 |
634 452 |
906 738 |
1223 1074 |
1225 835 |
72% |
29616 21253 |
|||||||||||||||||
| Jan11 [12] |
65 30 |
151 99 |
180 142 |
168 124 |
129 68 |
282 185 |
248 95 |
451 308 |
209 137 |
113 66 |
249 91 |
100 63 |
191 151 |
133 100 |
65 40 |
87 71 |
108 99 |
207 83 |
3136 1952 |
255 |
|||||||||||||||||
| Feb11 [13] |
57 15 |
149 85 |
136 96 |
118 87 |
78 41 |
199 118 |
259 81 |
310 223 |
412 290 |
215 148 |
164 44 |
58 30 |
134 93 |
95 72 |
26 10 |
42 28 |
79 71 |
123 50 |
2654 1582 |
188 |
|||||||||||||||||
| Mar11 [13] |
74 22 |
228 154 |
112 85 |
139 91 |
42 23 |
45 29 |
249 75 |
239 181 |
359 229 |
64 47 |
172 61 |
66 30 |
115 84 |
82 58 |
16 8 |
101 12 |
108 96 |
111 41 |
2322 1326 |
171 |
|||||||||||||||||
| Apr11 [12] |
59 14 |
315 204 |
112 82 |
108 64 |
38 22 |
67 41 |
239 62 |
207 137 |
273 168 |
72 56 |
134 48 |
63 37 |
126 95 |
75 57 |
19 8 |
11 6 |
119 107 |
100 35 |
2137 1243 |
142 |
|||||||||||||||||
| May11 [13] |
72 34 |
189 120 |
100 79 |
101 65 |
41 32 |
61 42 |
47 11 |
35 22 |
42 28 |
15 11 |
154 62 |
68 32 |
139 92 |
96 61 |
21 11 |
21 15 |
88 74 |
100 39 |
1390 830 |
194 |
|||||||||||||||||
| Jun11 [12] |
62 14 |
230 135 |
101 73 |
104 61 |
35 15 |
45 28 |
0 0 |
0 0 |
0 0 |
0 0 |
217 67 |
77 35 |
146 92 |
83 55 |
14 5 |
17 11 |
117 97 |
107 41 |
1355 729 |
97 |
|||||||||||||||||
| FY 10-11 [2] [24] |
830 343 |
2033 1366 |
1419 1071 |
1839 1328 |
879 546 |
2569 1763 |
1810 852 |
3228 2433 |
2522 1693 |
1295 931 |
1925 754 |
882 475 |
1900 1410 |
1542 1141 |
461 280 |
769 555 |
1318 1156 |
1355 689 |
66% |
28576 18786 |
|||||||||||||||||
| Jul11 [12] |
52 13 |
278 148 |
127 103 |
143 87 |
39 25 |
26 13 |
0 0 |
0 0 |
0 0 |
0 0 |
198 88 |
76 48 |
162 110 |
100 63 |
12 5 |
13 8 |
118 100 |
124 34 |
1468 845 |
77 |
|||||||||||||||||
| Aug11 [12] |
57 12 |
297 178 |
105 81 |
204 134 |
32 19 |
35 17 |
0 0 |
0 0 |
0 0 |
0 0 |
198 72 |
71 40 |
138 94 |
117 90 |
26 13 |
26 10 |
156 130 |
85 31 |
1547 921 |
48 |
|||||||||||||||||
| Sep11 [12] |
80 19 |
257 143 |
111 88 |
178 119 |
35 19 |
40 21 |
0 0 |
0 0 |
0 0 |
0 0 |
207 85 |
90 45 |
112 81 |
67 58 |
16 11 |
22 13 |
104 94 |
75 24 |
1394 820 |
58 |
|||||||||||||||||
| Oct11 [12] |
57 20 |
279 166 |
140 113 |
202 125 |
35 20 |
55 38 |
0 0 |
0 0 |
0 0 |
0 0 |
2192 66 |
113 91 |
166 122 |
122 95 |
84 24 |
31 20 |
129 145 |
112 39 |
3747 1084 |
51 |
|||||||||||||||||
| Nov11 [12] |
54 14 |
183 101 |
127 91 |
201 123 |
45 24 |
55 34 |
0 0 |
0 0 |
0 0 |
0 0 |
200 77 |
91 63 |
148 112 |
123 100 |
121 37 |
16 13 |
133 122 |
104 30 |
1601 941 |
64 |
|||||||||||||||||
| Dec11 [12] |
77 27 |
180 97 |
190 134 |
169 96 |
39 25 |
112 69 |
52 23 |
49 23 |
71 56 |
39 14 |
197 79 |
75 39 |
177 135 |
126 113 |
114 26 |
16 12 |
97 87 |
108 35 |
1888 1090 |
63 |
|||||||||||||||||
| 2011 [12] |
766 234 |
2736 1630 |
1541 1167 |
1835 1176 |
588 333 |
1022 635 |
1094 347 |
1291 894 |
1366 908 |
518 342 |
4282 2871 |
948 553 |
1754 1261 |
1219 922 |
534 198 |
403 219 |
1386 1222 |
1356 482 |
62% |
24639 15394 |
13502 |
||||||||||||||||
| Jan12 [13] |
53 11 |
138 87 |
103 67 |
181 105 |
53 34 |
78 46 |
50 30 |
59 40 |
252 198 |
100 37 |
196 72 |
79 47 |
193 148 |
178 148 |
111 25 |
17 12 |
84 78 |
101 35 |
2026 1220 |
66 |
|||||||||||||||||
| Feb12 [14] |
39 11 |
171 109 |
134 96 |
205 131 |
45 21 |
89 53 |
42 27 |
41 31 |
482 401 |
79 32 |
197 85 |
71 40 |
198 133 |
154 126 |
88 20 |
12 11 |
121 107 |
107 40 |
2275 1474 |
86 |
|||||||||||||||||
| Mar12 [15] |
59 14 |
186 110 |
136 99 |
193 129 |
53 33 |
107 55 |
51 34 |
37 29 |
310 243 |
113 58 |
219 89 |
93 46 |
235 157 |
158 120 |
118 16 |
22 9 |
138 120 |
124 56 |
2352 1417 |
100 |
|||||||||||||||||
| Apr12 [15] |
75 17 |
211 117 |
128 95 |
155 104 |
48 30 |
95 55 |
66 46 |
53 38 |
268 191 |
112 54 |
219 92 |
87 44 |
191 136 |
155 116 |
92 23 |
74 48 |
155 126 |
136 63 |
2320 1395 |
101 |
|||||||||||||||||
| May12 [15] |
59 14 |
295 160 |
184 136 |
206 133 |
57 33 |
108 63 |
102 57 |
48 41 |
227 168 |
131 55 |
262 91 |
94 59 |
207 141 |
172 126 |
112 20 |
80 57 |
203 155 |
144 60 |
2691 1569 |
114 |
|||||||||||||||||
| Jun12 [15] |
65 12 |
265 176 |
176 114 |
247 136 |
51 24 |
114 77 |
93 73 |
68 52 |
246 193 |
130 70 |
115 62 |
84 47 |
175 114 |
189 128 |
95 19 |
91 57 |
154 133 |
120 57 |
2478 1544 |
119 |
|||||||||||||||||
| FY 11-12 [2] [24] |
727 184 |
2740 1592 |
1661 1217 |
2284 1422 |
532 307 |
914 541 |
456 290 |
355 254 |
1856 1450 |
704 320 |
4400 958 |
1024 609 |
2102 1483 |
1661 1283 |
989 239 |
420 270 |
1592 1397 |
1340 504 |
56% |
25787 14320 |
|||||||||||||||||
| Jul12 [15] |
66 20 |
265 182 |
190 135 |
156 107 |
52 32 |
102 61 |
109 77 |
94 67 |
217 158 |
147 65 |
253 109 |
101 60 |
196 125 |
203 159 |
112 18 |
90 57 |
165 136 |
127 50 |
2645 1618 |
111 |
|||||||||||||||||
| Aug12 [15] |
72 19 |
254 168 |
204 145 |
273 190 |
92 53 |
108 68 |
110 76 |
64 53 |
240 178 |
119 60 |
245 115 |
94 51 |
205 142 |
171 135 |
156 41 |
93 65 |
224 191 |
158 61 |
2882 1812 |
128 |
|||||||||||||||||
| Sep12 [15] |
63 20 |
627 139 |
208 165 |
266 189 |
65 35 |
80 52 |
67 37 |
63 47 |
221 165 |
140 61 |
294 103 |
102 63 |
208 160 |
195 154 |
117 26 |
100 68 |
201 182 |
148 69 |
3165 1737 |
117 |
|||||||||||||||||
| Oct12 [16] |
43 13 |
250 141 |
263 153 |
292 182 |
68 41 |
106 66 |
92 47 |
74 46 |
288 202 |
118 55 |
254 85 |
86 48 |
229 170 |
196 162 |
102 25 |
84 53 |
206 165 |
150 53 |
2901 1707 |
143 |
|||||||||||||||||
| Nov12 [16] |
55 12 |
269 142 |
189 109 |
257 159 |
54 27 |
82 45 |
127 69 |
18 9 |
198 139 |
123 53 |
198 70 |
91 53 |
210 152 |
214 166 |
83 9 |
61 38 |
62 52 |
119 41 |
2410 1345 |
133 |
|||||||||||||||||
| Dec12 [16] |
59 17 |
232 118 |
201 127 |
236 131 |
58 31 |
78 36 |
36 21 |
77 38 |
225 154 |
201 91 |
127 46 |
95 54 |
161 119 |
185 129 |
94 20 |
51 36 |
118 94 |
122 39 |
2356 1301 |
114 |
|||||||||||||||||
| 2012 [17] |
708 177 |
3164 1635 |
2116 1435 |
2667 1682 |
696 388 |
1147 669 |
945 585 |
696 489 |
3175 2342 |
1514 679 |
2582 1011 |
1077 606 |
2408 1682 |
2170 1651 |
1110 239 |
775 511 |
1833 1532 |
1556 613 |
60% |
30339 18096 |
19603 |
||||||||||||||||
| Jan13 [16] |
84 21 |
170 94 |
171 89 |
286 165 |
67 37 |
49 22 |
57 24 |
74 54 |
138 91 |
89 28 |
204 86 |
77 39 |
197 147 |
181 155 |
104 22 |
86 69 |
135 107 |
95 33 |
57% |
2264 1283 |
130 |
||||||||||||||||
| Feb13 [16] |
50 8 |
193 116 |
133 85 |
217 136 |
49 26 |
61 33 |
78 33 |
73 50 |
108 84 |
81 35 |
191 68 |
50 27 |
100 76 |
123 102 |
69 17 |
49 32 |
126 103 |
88 35 |
58% |
1839 1066 |
128 |
||||||||||||||||
| Mar13 [16] |
83 28 |
266 152 |
235 129 |
234 120 |
61 25 |
92 45 |
144 68 |
97 66 |
184 107 |
128 54 |
242 100 |
80 39 |
209 159 |
194 140 |
125 19 |
78 39 |
152 124 |
127 53 |
54% |
2731 1467 |
154 |
||||||||||||||||
| Apr13 [16] |
71 28 |
318 186 |
197 110 |
255 157 |
53 24 |
108 72 |
255 103 |
171 116 |
265 187 |
186 100 |
293 121 |
104 52 |
187 135 |
182 131 |
104 25 |
91 50 |
158 129 |
156 61 |
57% |
3154 1787 |
134 |
||||||||||||||||
| May13 [17] |
75 19 |
232 147 |
198 107 |
264 155 |
74 38 |
139 76 |
242 169 |
159 121 |
383 287 |
258 158 |
337 130 |
102 41 |
208 133 |
203 146 |
0 0 |
74 46 |
160 119 |
161 61 |
60% |
3269 1953 |
157 |
||||||||||||||||
| Jun13 [17] |
114 23 |
232 133 |
184 109 |
272 138 |
65 30 |
105 52 |
269 193 |
132 93 |
381 260 |
259 137 |
284 112 |
99 35 |
214 142 |
203 141 |
0 0 |
151 54 |
184 136 |
176 72 |
56% |
3324 1860 |
157 |
||||||||||||||||
| FY
12-13 [2] [24] |
835 228 |
3308 1718 |
2373 1463 |
3008 1829 |
758 399 |
1110 628 |
1586 917 |
1096 760 |
2848 2012 |
1849 897 |
2922 1145 |
1081 562 |
2324 1660 |
2250 1720 |
1066 222 |
1008 607 |
1891 1538 |
1627 628 |
57% |
32940 18936 |
|||||||||||||||||
| Jul13 [18] |
103 19 |
240 136 |
209 120 |
315 188 |
67 36 |
83 50 |
150 109 |
109 84 |
422 290 |
265 156 |
267 117 |
126 62 |
237 158 |
205 154 |
0 0 |
73 41 |
208 158 |
177 67 |
60% |
3256 1945 |
165 |
||||||||||||||||
| Aug13 [18] |
81 19 |
200 95 |
210 128 |
337 200 |
78 32 |
69 41 |
153 106 |
140 109 |
472 308 |
280 137 |
283 102 |
132 60 |
164 118 |
209 151 |
0 0 |
91 55 |
202 161 |
167 55 |
57% |
3268 1877 |
180 |
||||||||||||||||
| Sep13 [18] |
67 18 |
169 73 |
178 110 |
359 193 |
89 38 |
138 75 |
166 90 |
137 105 |
369 226 |
265 132 |
287 103 |
138 64 |
214 159 |
215 142 |
0 0 |
111 77 |
164 131 |
173 46 |
55% |
3239 1782 |
143 |
||||||||||||||||
| Oct13 [18] |
49 6 |
159 75 |
117 69 |
355 175 |
82 30 |
112 69 |
165 101 |
166 101 |
448 241 |
266 131 |
251 77 |
157 59 |
191 113 |
197 113 |
0 0 |
115 71 |
214 157 |
150 33 |
51% |
3194 1621 |
186 |
||||||||||||||||
| Nov13 [18] |
69 19 |
208 73 |
167 98 |
270 152 |
73 34 |
99 57 |
182 102 |
125 94 |
382 254 |
237 127 |
226 64 |
125 72 |
237 151 |
251 184 |
0 0 |
101 74 |
138 112 |
160 42 |
56% |
3050 1709 |
146 |
||||||||||||||||
| Dec13 [19] |
57 17 |
185 76 |
179 138 |
318 189 |
80 36 |
106 70 |
74 44 |
115 90 |
260 186 |
266 175 |
126 70 |
89 50 |
254 175 |
260 194 |
0 0 |
54 42 |
148 108 |
117 43 |
64% |
2688 1703 |
180 |
||||||||||||||||
| 2013 [2][23] |
903 225 |
2572 1356 |
2178 1292 |
3482 1968 |
838 386 |
1161 662 |
1935 1142 |
1498 1083 |
3812 2521 |
2580 1370 |
2991 1150 |
1279 600 |
2412 1666 |
2423 1753 |
402 83 |
1074 650 |
1989 1545 |
1747 601 |
57% |
35276 20053 |
25318 |
18218 2305 |
|||||||||||||||
| Cam # |
CEWA 01 |
CIWA 01 |
JECO 01 |
JEDU 01 |
JEDU 03 |
JEOV 03 |
SEGV 01 |
SEGV 03 |
SESL 01 |
SESL 03 |
SLBU 01 |
SLBU 03 |
WABE 01 |
WABE 03 |
WACE 01 |
WAHE 01 |
WAHE 03 |
WASA 01 |
|||||||||||||||||||
| Jan14 [19] |
74 10 |
183 84 |
128 87 |
320 188 |
60 13 |
73 40 |
140 93 |
144 100 |
312 242 |
190 103 |
223 100 |
113 62 |
230 158 |
218 173 |
42 19 |
71 60 |
128 93 |
152 63 |
60% |
2801 1688 |
179 |
||||||||||||||||
| Feb14 [19] |
46 12 |
190 72 |
108 60 |
302 194 |
57 29 |
64 38 |
147 98 |
159 118 |
323 239 |
237 113 |
337 134 |
98 46 |
156 123 |
193 148 |
0 0 |
83 63 |
186 154 |
129 52 |
60% |
2815 1693 |
168 |
||||||||||||||||
| Mar14 [19] |
51 16 |
260 104 |
155 91 |
339 195 |
98 48 |
99 53 |
160 110 |
160 98 |
372 261 |
219 127 |
410 154 |
142 58 |
164 115 |
210 162 |
0 0 |
98 58 |
203 164 |
151 53 |
57% |
3291 1867 |
170 |
||||||||||||||||
| Apr14 [19] |
55 12 |
254 114 |
162 102 |
332 190 |
94 41 |
91 55 |
222 173 |
167 126 |
342 190 |
257 147 |
386 133 |
102 52 |
169 105 |
228 160 |
176 62 |
86 61 |
183 152 |
148 47 |
56% |
3454 1922 |
179 |
||||||||||||||||
| May14 [19] |
58 8 |
249 93 |
169 83 |
402 191 |
96 50 |
106 47 |
248 161 |
155 114 |
366 219 |
275 139 |
549 101 |
131 63 |
169 109 |
252 163 |
160 41 |
87 50 |
198 123 |
162 49 |
47% |
3832 1804 |
183 |
||||||||||||||||
| Jun14 [19] |
28 4 |
292 118 |
164 95 |
369 177 |
96 44 |
90 48 |
243 156 |
174 128 |
226 152 |
276 140 |
448 117 |
143 69 |
142 82 |
196 126 |
131 20 |
89 52 |
217 143 |
188 56 |
49% |
3512 1727 |
148 |
||||||||||||||||
| FY
13-14 [2] [24] |
738 160 |
2589 1113 |
1946 1181 |
4018 2232 |
970 431 |
1130 643 |
2050 1343 |
1751 1267 |
4294 2808 |
3033 1627 |
3793 1272 |
1496 717 |
2327 1566 |
2634 1870 |
509 142 |
1059 704 |
2189 1656 |
1874 606 |
56% |
38400 21338 |
|||||||||||||||||
| Jul14 [20] |
256 108 |
197 105 |
366 175 |
94 41 |
82 39 |
223 136 |
176 114 |
291 167 |
311 144 |
406 122 |
159 68 |
188 113 |
225 149 |
96 49 |
223 150 |
137 30 |
50% |
3430 1710 |
160 |
||||||||||||||||||
| Aug14 [20] |
272 107 |
208 126 |
412 212 |
111 55 |
92 45 |
228 156 |
234 158 |
309 171 |
314 153 |
392 121 |
166 80 |
161 95 |
217 159 |
89 47 |
217 179 |
132 31 |
53% |
3554 1895 |
158 |
||||||||||||||||||
| Sep14 [20] |
273 90 |
180 109 |
372 214 |
85 49 |
107 54 |
192 133 |
151 91 |
296 171 |
293 166 |
363 114 |
133 59 |
194 136 |
241 175 |
99 64 |
166 132 |
174 48 |
54% |
3319 1805 |
169 |
||||||||||||||||||
| Oct14 [21][22][25] [34] |
244 115 |
192 110 |
392 225 |
117 33 |
112 65 |
293 194 |
218 142 |
366 220 |
281 153 |
411 128 |
117 32 |
187 134 |
233 168 |
132 105 |
254 189 |
182 58 |
56% |
3731 2071 |
208 |
||||||||||||||||||
| Nov14 [22][25] [34] |
250 95 |
198 121 |
362 168 |
93 42 |
99 49 |
203 113 |
172 108 |
334 186 |
347 173 |
512 107 |
138 53 |
228 136 |
290 164 |
106 70 |
159 108 |
141 29 |
47% |
3632 1722 |
189 |
||||||||||||||||||
| Dec14 [22][25] |
281 105 |
252 120 |
384 166 |
99 35 |
90 45 |
271 145 |
157 76 |
336 166 |
423 182 |
360 127 |
120 50 |
163 92 |
245 147 |
78 50 |
142 96 |
145 24 |
46% |
3546 1626 |
162 |
||||||||||||||||||
| 2014 [2] [25] [34] |
312 62 |
3004 1205 |
2113 1209 |
4352 2295 |
1100 480 |
1105 578 |
2570 1668 |
2067 1373 |
3873 2384 |
3423 1740 |
4797 1458 |
1562 692 |
2151 1398 |
2748 1894 |
509 142 |
1114 729 |
2276 1683 |
1841 540 |
53% |
40917 21530 |
27048 |
19514 2593 |
|||||||||||||||
| Jan15 [27] |
255 126 |
187 128 |
417 228 |
84 41 |
62 35 |
152 101 |
144 76 |
278 171 |
282 139 |
313 118 |
148 73 |
157 113 |
278 189 |
74 56 |
126 89 |
127 42 |
56% |
3084 1725 |
1912 |
154 |
|||||||||||||||||
| Feb15 [26] |
268 130 |
318 235 |
350 224 |
86 41 |
100 68 |
173 105 |
130 98 |
233 185 |
274 170 |
545 161 |
187 51 |
112 77 |
223 178 |
98 60 |
154 132 |
155 68 |
58% |
3406 1983 |
155 |
||||||||||||||||||
| Mar15 [27] |
332 170 |
374 299 |
411 278 |
99 53 |
94 56 |
173 102 |
116 78 |
326 235 |
323 177 |
1265 220 |
199 60 |
210 145 |
267 200 |
116 97 |
206 174 |
209 88 |
52% |
4720 2432 |
199 |
||||||||||||||||||
| Apr15 [28] |
45 14 |
281 147 |
304 235 |
344 227 |
106 62 |
111 53 |
161 103 |
143 103 |
332 251 |
343 231 |
502 144 |
202 83 |
178 121 |
254 194 |
40 12 |
93 72 |
155 126 |
166 80 |
60% |
3760 2258 |
205 |
||||||||||||||||
| May15 [28] |
66 23 |
339 186 |
234 180 |
385 251 |
111 66 |
130 85 |
241 161 |
205 147 |
314 230 |
338 220 |
405 128 |
127 70 |
200 127 |
220 163 |
33 9 |
115 80 |
130 107 |
155 66 |
61% |
3748 2299 |
202 |
||||||||||||||||
| Jun15 [29] |
57 14 |
308 177 |
154 121 |
378 267 |
117 65 |
116 72 |
303 199 |
212 158 |
328 244 |
360 212 |
556 174 |
47 14 |
200 128 |
167 128 |
33 6 |
112 83 |
146 109 |
138 55 |
60% |
3732 2226 |
203 |
||||||||||||||||
| FY
14-15 [2] [24] [34] |
168 51 |
3359 1556 |
2798 1889 |
4573 2635 |
1202 583 |
1195 666 |
2613 1648 |
2058 1349 |
3743 2397 |
3889 2120 |
6030 1664 |
1743 693 |
2178 1417 |
2860 2014 |
106 27 |
1208 833 |
2078 1591 |
1861 619 |
57% |
43662 23752 |
|||||||||||||||||
| Jul15 [29] |
47 5 |
230 118 |
139 91 |
365 229 |
96 47 |
138 87 |
142 95 |
125 81 |
334 248 |
342 215 |
396 113 |
43 13 |
119 63 |
94 71 |
42 1 |
42 30 |
73 46 |
106 32 |
55% |
2873 1585 |
176 |
||||||||||||||||
| Aug15 [29] |
54 18 |
271 133 |
182 124 |
324 200 |
103 49 |
168 103 |
102 61 |
113 79 |
376 286 |
364 242 |
252 99 |
50 10 |
122 76 |
147 106 |
48 2 |
67 50 |
109 86 |
105 36 |
60% |
2957 1760 |
163 |
||||||||||||||||
| Sep15 [29] |
70 11 |
250 128 |
164 117 |
305 202 |
106 45 |
182 108 |
121 48 |
110 86 |
300 214 |
334 197 |
200 82 |
54 12 |
120 65 |
146 111 |
41 1 |
63 45 |
126 104 |
115 38 |
58% |
2807 1614 |
159 |
||||||||||||||||
| Oct15 [29] |
60 12 |
285 138 |
176 122 |
344 241 |
130 78 |
205 136 |
151 104 |
123 85 |
337 244 |
392 248 |
358 154 |
51 8 |
127 85 |
88 63 |
36 1 |
77 52 |
129 110 |
133 52 |
60% |
3202 1933 |
154 |
||||||||||||||||
| Nov15 [29] |
206 52 |
218 97 |
139 84 |
241 166 |
115 59 |
109 70 |
32 20 |
23 18 |
268 220 |
204 96 |
241 100 |
67 14 |
117 70 |
81 64 |
52 6 |
66 45 |
93 57 |
68 27 |
54% |
2340 1265 |
132 |
||||||||||||||||
| Dec15 [30] |
564 251 |
199 88 |
158 115 |
264 152 |
101 49 |
133 55 |
85 33 |
684 549 |
432 361 |
370 180 |
519 102 |
824 15 |
122 79 |
111 83 |
78 32 |
51 34 |
52 39 |
10 6 |
47% |
4757 2223 |
143 |
||||||||||||||||
| 2015 [2] |
1169 400 |
3236 1638 |
2529 1851 |
4128 2665 |
1254 655 |
1548 928 |
1836 1132 |
2128 1558 |
3858 2889 |
3926 2327 |
5552 1595 |
1999 423 |
1784 1149 |
2076 1550 |
403 70 |
974 704 |
1499 1179 |
1487 590 |
56% |
41386 23303 |
23506 |
20682 4208 |
|||||||||||||||
| Jan16 [30] |
448 162 |
148 61 |
125 94 |
416 235 |
90 53 |
118 41 |
178 81 |
865 675 |
297 212 |
290 155 |
185 57 |
113 20 |
90 53 |
64 44 |
102 50 |
42 29 |
60 41 |
63 37 |
57% |
3694 2100 |
156 |
||||||||||||||||
| Feb16 [32] |
578 231 |
151 74 |
184 100 |
300 173 |
55 14 |
137 67 |
180 75 |
1041 808 |
426 277 |
225 127 |
239 104 |
99 20 |
127 78 |
86 33 |
80 47 |
16 7 |
82 54 |
52 34 |
57% |
4058 2323 |
169 |
||||||||||||||||
| Mar16 [32] |
482 200 |
145 66 |
222 134 |
517 292 |
150 64 |
165 78 |
210 100 |
1692 1295 |
366 234 |
337 191 |
308 102 |
128 28 |
150 108 |
71 34 |
43 30 |
95 53 |
129 93 |
57 31 |
60% |
5267 3133 |
182 |
||||||||||||||||
| Apr16 [32] |
571 243 |
198 95 |
172 126 |
547 273 |
172 85 |
176 99 |
250 115 |
1819 1317 |
483 316 |
330 196 |
296 118 |
133 22 |
161 94 |
103 66 |
84 50 |
102 52 |
124 81 |
170 107 |
59% |
5891 3455 |
196 |
||||||||||||||||
| May16 [33] |
569 208 |
220 114 |
192 143 |
548 296 |
186 81 |
165 103 |
267 154 |
1858 1387 |
517 325 |
356 216 |
221 108 |
95 20 |
146 84 |
105 62 |
85 57 |
81 42 |
155 94 |
362 214 |
61% |
6128 3708 |
209 |
||||||||||||||||
| Jun16 [33] |
563 231 |
233 133 |
190 132 |
392 221 |
165 67 |
163 100 |
295 187 |
1561 1193 |
505 293 |
392 245 |
237 93 |
106 27 |
118 73 |
121 69 |
107 63 |
98 49 |
169 121 |
342 203 |
61% |
5757 3500 |
222 |
||||||||||||||||
| FY
15-16 [2] [24] [34] |
4212 1624 |
2548 1245 |
2043 1382 |
4563 2680 |
1469 691 |
1859 1047 |
2013 1073 |
10014 7573 |
4641 3230 |
3936 2308 |
3452 1232 |
1763 209 |
1519 928 |
1217 806 |
798 340 |
800 488 |
1301 926 |
1583 817 |
58% |
49731 28599 |
|||||||||||||||||
| Jul16 [34] |
594 225 |
278 158 |
171 128 |
643 326 |
178 79 |
177 114 |
283 157 |
1567 1051 |
565 358 |
382 223 |
303 127 |
175 26 |
118 74 |
136 62 |
106 57 |
114 62 |
184 114 |
409 228 |
56% |
6383 3569 |
235 |
||||||||||||||||
| Aug16 [34] |
595 183 |
326 201 |
228 154 |
656 347 |
209 76 |
200 128 |
228 132 |
1223 837 |
501 319 |
400 242 |
292 124 |
114 32 |
142 86 |
125 41 |
104 61 |
104 63 |
180 129 |
344 166 |
56% |
5971 3321 |
281 |
||||||||||||||||
| Sep16 [35] |
538 188 |
294 151 |
225 155 |
600 307 |
181 63 |
191 112 |
209 136 |
1875 1327 |
424 274 |
412 234 |
279 114 |
90 14 |
109 80 |
122 41 |
84 50 |
111 60 |
190 153 |
354 178 |
58% |
6288 3637 |
255 |
||||||||||||||||
| Oct16 [35] |
534 163 |
248 133 |
232 157 |
572 309 |
205 71 |
163 96 |
241 151 |
1818 1300 |
548 312 |
451 256 |
278 113 |
119 31 |
176 104 |
171 31 |
189 92 |
109 57 |
219 140 |
384 194 |
56% |
6657 3710 |
259 |
||||||||||||||||
| Nov16 [35] |
515 154 |
263 141 |
186 123 |
571 306 |
195 65 |
170 111 |
302 155 |
1512 1086 |
461 246 |
436 253 |
232 91 |
123 31 |
205 115 |
176 45 |
82 44 |
121 65 |
201 134 |
318 146 |
55% |
6069 3311 |
275 |
||||||||||||||||
| Dec16 [36] |
439 121 |
199 100 |
274 181 |
537 232 |
250 70 |
151 106 |
266 149 |
2039 1344 |
530 263 |
473 255 |
271 87 |
126 41 |
218 107 |
139 57 |
68 33 |
87 50 |
114 79 |
251 101 |
52% |
6432 3376 |
259 |
||||||||||||||||
| 2016 [1] [36] |
6426 2309 |
2703 1428 |
2401 1627 |
6299 3317 |
2036 787 |
1976 1155 |
0 0 |
0 0 |
0 0 |
0 0 |
2909 1592 |
18870 13620 |
5551 3451 |
4484 2593 |
0 0 |
0 0 |
3141 1238 |
1421 312 |
1760 1056 |
1419 585 |
1134 634 |
1080 589 |
1807 1233 |
3106 1639 |
57% |
68595 39143 |
39202 |
34691 20719 |
|||||||||
| Jan17 [37] |
375 103 |
204 92 |
184 123 |
369 135 |
709 57 |
127 76 |
0 0 |
0 0 |
0 0 |
0 0 |
195 107 |
1614 1106 |
366 192 |
295 152 |
0 0 |
0 0 |
163 62 |
97 27 |
156 84 |
140 85 |
89 44 |
85 48 |
137 100 |
261 121 |
5566 2714 |
49% |
5566 2714 |
295 |
|||||||||
| Feb17 [37] |
379 109 |
226 118 |
159 117 |
366 121 |
180 60 |
130 81 |
3 2 |
0 0 |
0 0 |
0 0 |
148 90 |
1403 968 |
353 198 |
310 179 |
0 0 |
0 0 |
223 69 |
82 24 |
157 81 |
154 100 |
72 41 |
110 66 |
142 100 |
244 112 |
4838 2634 |
54% |
4841 2636 |
226 |
|||||||||
| Mar17 [37] |
438 140 |
319 157 |
235 145 |
363 111 |
212 58 |
153 102 |
1 0 |
9 0 |
58 0 |
146 0 |
181 111 |
1614 1045 |
468 242 |
347 204 |
26 0 |
22 0 |
333 99 |
113 36 |
185 94 |
189 94 |
127 63 |
136 72 |
260 194 |
357 168 |
6030 3135 |
50% |
6292 3135 |
288 |
|||||||||
| Apr17 [37] |
479 136 |
302 160 |
153 112 |
434 131 |
204 57 |
163 102 |
244 141 |
730 208 |
430 129 |
667 399 |
207 106 |
1551 1011 |
449 255 |
359 197 |
285 170 |
394 216 |
362 108 |
110 43 |
174 79 |
172 97 |
118 47 |
86 38 |
209 153 |
302 135 |
5834 2967 |
49% |
8584 4230 |
269 |
|||||||||
| May17 [37] |
499 159 |
327 158 |
175 123 |
377 140 |
205 81 |
172 106 |
142 103 |
692 268 |
202 91 |
236 165 |
226 122 |
1732 1256 |
429 230 |
360 214 |
173 119 |
223 148 |
247 88 |
126 28 |
174 83 |
236 119 |
21 8 |
34 22 |
66 46 |
78 44 |
5484 3027 |
55% |
7152 3921 |
254 |
|||||||||
| Jun17 [37] [39] |
527 209 |
309 185 |
191 136 |
344 176 |
185 68 |
170 112 |
171 98 |
1455 295 |
629 196 |
945 516 |
184 119 |
1491 1101 |
510 303 |
325 206 |
328 181 |
408 212 |
232 87 |
80 24 |
152 76 |
204 117 |
[39] |
[39] | [39] | [39] | 4904 2919 |
50% |
8840 4417 |
271 |
|||||||||
| FY
16-17 [2] [24] |
5912 1890 |
3295 1754 |
2413 1654 |
5832 2641 |
2913 805 |
1967 1246 |
561 344 |
2886 771 |
1319 416 |
1994 1080 |
2670 1535 |
19439 13432 |
5604 3192 |
4550 2615 |
812 470 |
1047 576 |
3215 1169 |
1355 357 |
1966 1063 |
1964 889 |
1060 540 |
1097 603 |
1902 1342 |
3302 1593 |
70456 38320 |
53% |
79075 41977 |
||||||||||
| Jul17 [40] |
449 156 |
311 180 |
229 146 |
335 147 |
180 68 |
109 68 |
283 141 |
749 158 |
736 185 |
1057 523 |
260 173 |
1700 1310 |
546 333 |
358 224 |
339 180 |
327 154 |
221 71 |
120 34 |
191 84 |
212 118 |
0 0 |
0 0 |
0 0 |
0 0 |
5221 3112 |
51% |
8712 4453 |
270 |
|||||||||
| Aug17 [40] |
331 122 |
354 207 |
230 150 |
356 175 |
221 72 |
135 73 |
303 158 |
1102 228 |
936 286 |
929 472 |
264 166 |
1670 1160 |
568 332 |
431 282 |
382 201 |
490 199 |
293 112 |
140 46 |
199 99 |
215 120 |
0 0 |
0 0 |
0 0 |
0 0 |
5407 3116 |
49% |
9549 4660 |
321 |
|||||||||
| Sep17 [40] |
393 131 |
256 132 |
259 165 |
376 167 |
245 77 |
149 84 |
311 163 |
1007 239 |
932 267 |
946 431 |
192 113 |
1355 948 |
545 315 |
393 271 |
298 163 |
396 162 |
338 146 |
132 51 |
180 98 |
201 118 |
0 0 |
0 0 |
0 0 |
0 0 |
5014 2816 |
48% |
8904 4241 |
323 |
|||||||||
| Oct17 [43] |
851 183 |
319 111 |
278 93 |
318 148 |
228 65 |
162 62 |
246 126 |
904 194 |
907 293 |
1024 426 |
200 115 |
1492 1061 |
528 312 |
424 264 |
301 145 |
355 145 |
298 142 |
105 31 |
247 128 |
189 106 |
0 0 |
0 0 |
0 0 |
0 0 |
5639 2821 |
44% |
9376 4150 |
336 |
|||||||||
| Nov17 [43] |
975 171 |
267 134 |
177 120 |
301 135 |
208 84 |
143 99 |
285 129 |
920 168 |
728 182 |
1101 439 |
188 111 |
1513 1108 |
458 289 |
411 285 |
292 112 |
238 47 |
246 129 |
117 36 |
195 118 |
172 123 |
0 0 |
0 0 |
0 0 |
0 0 |
5371 2942 |
45% |
8935 4019 |
323 |
|||||||||
| Dec17 [43] |
664 141 |
263 136 |
192 124 |
297 143 |
228 69 |
177 110 |
241 94 |
850 178 |
916 221 |
1070 441 |
199 114 |
1770 1314 |
504 326 |
458 318 |
282 115 |
657 131 |
210 102 |
116 39 |
160 82 |
128 82 |
0 0 |
0 0 |
0 0 |
0 0 |
5366 3100 |
46% |
9382 4280 |
4205 |
293 |
||||||||
| 2017 [1] [43] |
6360 1760 |
3457 1770 |
2462 1552 |
4236 1728 |
3005 816 |
1790 1075 |
2230 1155 |
8418 1935 |
6476 1850 |
8121 3812 |
2444 1447 |
18905 13388 |
5724 3327 |
4471 2796 |
2706 1386 |
3510 1414 |
3166 1215 |
1338 419 |
2170 1106 |
2212 1279 |
427 202 |
451 246 |
814 563 |
1242 580 |
64674 35269 |
49% |
96135 46851 |
45910 |
45060 27807 |
||||||||
| 2017 [38] (proj.) |
2966 1536 |
11196 2574 |
8613 2461 |
10801 5070 |
3599 1843 |
4668 1881 |
|||||||||||||||||||||||||||||||
| Jan18 [43] |
345 116 |
285 144 |
155 86 |
297 138 |
188 74 |
176 103 |
226 85 |
826 173 |
737 181 |
1083 429 |
170 84 |
1395 1001 |
460 304 |
297 200 |
276 126 |
642 112 |
241 96 |
107 33 |
154 75 |
166 109 |
0 0 |
0 0 |
0 0 |
0 0 |
4436 2563 |
45% |
8226 3669 |
3995 |
340 |
||||||||
| Feb18 [43] |
334 123 |
256 114 |
143 87 |
288 140 |
155 47 |
173 104 |
200 84 |
884 209 |
659 175 |
1086 434 |
159 102 |
1379 995 |
378 216 |
290 183 |
298 144 |
432 94 |
197 94 |
84 34 |
172 101 |
131 84 |
0 0 |
0 0 |
0 0 |
0 0 |
4139 2424 |
46% |
7698 3564 |
3472 |
311 |
||||||||
| Mar18 [43] |
390 137 |
224 103 |
145 86 |
300 149 |
186 73 |
197 131 |
173 69 |
982 208 |
622 133 |
1055 412 |
156 97 |
1562 1039 |
425 215 |
335 219 |
328 124 |
693 126 |
241 107 |
91 25 |
179 94 |
191 132 |
0 0 |
0 0 |
0 0 |
0 0 |
4622 2607 |
43% |
8475 3679 |
3886 |
360 |
||||||||
| Apr18 [45] |
467 99 |
169 80 |
116 67 |
276 150 |
184 60 |
220 151 |
202 68 |
997 222 |
657 174 |
1057 421 |
217 135 |
1223 842 |
501 294 |
365 249 |
360 167 |
668 157 |
287 131 |
109 46 |
187 108 |
216 139 |
0 0 |
0 0 |
0 0 |
0 0 |
4537 2551 |
44% |
8478 3760 |
4207 |
330 |
||||||||
| May18 [45] |
348 133 |
170 85 |
141 89 |
266 123 |
201 70 |
219 139 |
184 50 |
1025 192 |
0798 146 |
311 109 |
202 135 |
1527 1034 |
545 332 |
421 270 |
347 159 |
711 130 |
231 106 |
94 40 |
185 103 |
222 159 |
0 0 |
0 0 |
0 0 |
0 0 |
4772 2818 |
44% |
8148 3604 |
3738 |
272 |
||||||||
| Jun18 [45] |
319 148 |
218 116 |
151 107 |
227 115 |
197 78 |
190 125 |
189 69 |
1000 211 |
677 229 |
0 0 |
239 146 |
1626 1198 |
556 343 |
415 274 |
417 199 |
496 130 |
207 80 |
116 48 |
175 92 |
212 123 |
0 0 |
0 0 |
0 0 |
0 0 |
4848 2993 |
50% |
7627 3831 |
3372 |
277 |
||||||||
| FY 17-18 [2] [24] |
5866 1660 |
3092 1542 |
2216 1320 |
3637 1730 |
2421 837 |
2050 1249 |
2843 1236 |
11246 2380 |
9305 2472 |
10719 4537 |
2446 1491 |
18212 13010 |
6014 3611 |
4598 3039 |
3920 1835 |
6105 1587 |
3010 1316 |
1331 463 |
2224 1182 |
2255 1413 |
0 0 |
0 0 |
0 0 |
0 0 |
59372 33863 |
46% |
103510 47910 |
||||||||||
| Jul18 [45] |
389 176 |
188 93 |
183 121 |
305 149 |
213 80 |
238 145 |
170 50 |
1003 161 |
511 150 |
0 0 |
223 125 |
1653 1159 |
545 321 |
449 289 |
390 153 |
293 54 |
205 81 |
131 50 |
206 110 |
238 147 |
0 0 |
0 0 |
0 0 |
0 0 |
5166 3046 |
48% |
7533 3614 |
3776 |
264 |
||||||||
| Aug18 [45] |
256 122 |
274 118 |
232 159 |
347 173 |
236 93 |
236 151 |
161 64 |
1141 183 |
430 114 |
0 0 |
299 206 |
1691 1071 |
377 175 |
183 101 |
274 117 |
798 142 |
240 94 |
95 33 |
202 111 |
204 124 |
0 0 |
0 0 |
0 0 |
0 0 |
4872 2731 |
44% |
7676 3351 |
2961 |
251 |
||||||||
| Sep18 [45] |
290 133 |
280 110 |
172 115 |
373 205 |
217 75 |
230 151 |
118 50 |
591 53 |
498 150 |
0 0 |
216 167 |
1657 1036 |
399 202 |
128 76 |
212 79 |
678 151 |
267 133 |
82 35 |
144 81 |
162 92 |
0 0 |
0 0 |
0 0 |
0 0 |
4617 2611 |
46% |
6714 3094 |
3744 |
290 |
||||||||
| Oct18 [45] |
368 162 |
300 134 |
186 109 |
349 179 |
216 87 |
201 128 |
132 57 |
43 14 |
554 186 |
0 0 |
221 162 |
1661 1084 |
412 223 |
177 95 |
204 88 |
565 129 |
268 125 |
124 39 |
177 100 |
166 101 |
0 0 |
0 0 |
0 0 |
0 0 |
4826 2728 |
51% |
6324 3202 |
3453 |
259 |
||||||||
| Nov18 [45] |
356 159 |
344 149 |
182 116 |
260 113 |
192 96 |
72 28 |
148 39 |
330 25 |
274 84 |
0 0 |
210 162 |
1643 1046 |
386 203 |
157 78 |
294 113 |
203 46 |
235 101 |
80 29 |
198 108 |
163 98 |
0 0 |
0 0 |
0 0 |
0 0 |
4478 2486 |
49% |
5727 2793 |
2599 |
276 |
||||||||
| Dec18 [45] |
338 157 |
362 171 |
166 103 |
227 108 |
192 77 |
91 47 |
164 43 |
886 151 |
424 129 |
0 0 |
198 148 |
1716 1178 |
417 205 |
176 97 |
289 122 |
524 119 |
208 90 |
74 22 |
202 124 |
166 118 |
0 0 |
0 0 |
0 0 |
0 0 |
4533 2645 |
47% |
6820 3209 |
2828 |
242 |
||||||||
| 2018 [2] |
4200 1665 |
3070 1417 |
1972 1245 |
3515 1742 |
2377 910 |
2243 1403 |
2067 728 |
9708 1802 |
6841 1851 |
4592 1805 |
2510 1669 |
18733 12683 |
5401 3033 |
3393 2131 |
3689 1591 |
6703 1390 |
2827 1238 |
1187 434 |
2181 1207 |
2237 1426 |
0 0 |
0 0 |
0 0 |
0 0 |
55846 32203 |
46% |
89446 41370 |
42031 |
41370 25320 |
||||||||
| Jan19 [46] |
1702 1192 |
47% |
6536 3043 |
3209 |
261 |
||||||||||||||||||||||||||||||||
| Feb19 [46] |
1571 1124 |
49% |
6334 3101 |
3208 |
230 |
||||||||||||||||||||||||||||||||
| Mar19 [46] |
1688 1167 |
46% |
7225 3290 |
2917 |
284 |
||||||||||||||||||||||||||||||||
| Apr19 [46] |
1555 1082 |
43% |
7612 3297 |
3559 |
344 |
||||||||||||||||||||||||||||||||
| May19 [46] |
1551 1134 |
46% |
7420 3443 |
3711 |
277 |
||||||||||||||||||||||||||||||||
| Jun19 [46] |
1492 1078 |
44% |
7490 3318 |
3101 |
280 |
||||||||||||||||||||||||||||||||
| FY
18-19 [2] [24] |
19580 13351 |
46% |
83411 38755 |
||||||||||||||||||||||||||||||||||
| Jul19 [46] |
379 151 |
414 181 |
158 117 |
296 147 |
167 59 |
158 86 |
0 0 |
938 163 |
406 111 |
0 0 |
351 230 |
1948 1399 |
356 199 |
186 107 |
230 88 |
603 122 |
362 166 |
98 19 |
255 132 |
192 102 |
0 0 |
0 0 |
0 0 |
0 0 |
5320 3095 |
48% |
7497 3579 |
3761 |
269 |
||||||||
| Aug19 [46] |
470 196 |
394 191 |
171 112 |
296 149 |
193 70 |
185 93 |
0 0 |
899 129 |
394 97 |
0 0 |
380 227 |
1802 1255 |
402 237 |
215 133 |
209 90 |
728 152 |
319 138 |
127 39 |
233 143 |
207 117 |
0 0 |
0 0 |
0 0 |
0 0 |
5394 3100 |
47% |
7624 3568 |
3387 |
260 |
||||||||
| Sep19 [46] |
344 149 |
431 226 |
137 97 |
313 153 |
192 61 |
189 112 |
0 0 |
756 125 |
334 120 |
0 0 |
333 231 |
1439 1035 |
335 168 |
185 124 |
222 102 |
861 149 |
301 131 |
111 46 |
221 152 |
180 104 |
0 0 |
0 0 |
0 0 |
0 0 |
4711 2789 |
48% |
6884 3285 |
3311 |
250 |
||||||||
| Oct19 [47] |
407 166 |
438 221 |
146 101 |
261 133 |
240 83 |
168 85 |
0 0 |
562 91 |
433 136 |
971 277 |
402 259 |
1361 974 |
325 191 |
191 116 |
232 117 |
836 174 |
340 154 |
176 71 |
276 185 |
205 134 |
0 0 |
0 0 |
0 0 |
0 0 |
4936 2873 |
46% |
7970 3668 |
3959 |
271 |
||||||||
| Nov19 [47] |
1469 1097 |
48% |
6727 3230 |
2856 |
|||||||||||||||||||||||||||||||||
| Dec19 [47] |
1574 1151 |
41% |
7974 3304 |
||||||||||||||||||||||||||||||||||
| 2019 [1] [47] | 4408 1842 |
4830 2201 |
1833 1243 |
2902 1454 |
2158 740 |
1678 867 |
849 209 |
10296 1969 |
5505 1459 |
2785 591 |
4029 2544 |
19120 13671 |
4192 2262 |
2199 1315 |
2630 1079 |
7987 1652 |
3353 1511 |
1538 532 |
2487 1542 |
2224 1351 |
0 0 |
0 0 |
0 0 |
0 0 |
56951 33075 |
46% |
87003 40034 |
||||||||||
| Cam # |
CEWA 01 [22] |
CIWA 01 |
JECO 01 [22] |
JEDU 01 |
JEDU 03 |
JEOV 03 |
NAWA 01 [31] [38] |
NAWA 03 [31] [38] |
OVWA 01 [31] [38] |
OVWA 03 [31] [38] |
SEGV 01 [22] |
SEGV 03 [22] |
SESL 01 |
SESL 03 |
SEWA 01 [31] [38] |
SEWA 03 [31] [38] |
SLBU 01 |
SLBU 03 |
WABE 01 [22] |
WABE 03 [22] |
WACE 01 [22] |
WAHE 01 |
WAHE 03 [22] |
WASA 01 [22] |
[3] | A |
B |
C |
D |
E |
F |
||||||
| [5] [6] |
Cen- tin- ela Nbd @ Wash- ing- ton Pl. |
La Cien- ega Nbd @ Wash- ing- ton |
Jef- fer- son Wbd @ Cota |
Jef- fer- son Wbd @ Du- que- sne |
Jef- fer- son Ebd @ Du- que- sne |
Jef- fer- son Ebd @ Over- land |
Nat- ional Xbd @ Wash- ing- ton |
Nat- ional Xbd @ Wash- ing- ton |
Over- land Sbd @ Wash- ing- ton |
Over- land Nbd @ Wash- ing- ton |
Sepul- veda Sbd @ Green Val- ley |
Sepul- veda Nbd @ Green Val- ley |
Sepul- veda Nbd @ Slau- son |
Sepul- veda Sbd @ Slau- son |
Sepul- veda Xbd @ Wash- ing- ton |
Sepul- veda Xbd @ Wash- ing- ton |
Slau- son Wbd @ Buck- ing- ham |
Slau- son Ebd @ Buck- ing- ham |
Wash- ing- ton Wbd @ Beet- ho- ven |
Wash- ing- ton Ebd @ Beet- ho- ven |
Wash- ing- ton Pl. Ebd @ Cen- tin- ela |
Wash- ing- ton Ebd @ Helms |
Wash- ing- ton Wbd @ Helms |
Wash- ing- ton Ebd @ Saw- telle |
|
Total Notices Printed as % of Vio- lations Re- corded All Cameras |
Total Violations Recorded/ Notices Printed Per Official Monthly CMR Reports All Cameras [1] [4] |
Total Cites per the CCPD Monthly Report [44] |
Total Citations Issued/ Rolling Right Citations Per CVC 21455.5(i) Annual Reports All Cameras [41] |
Revenue from Court (thou- sands) [42] |
This table made by highwayrobbery.net, using official reports provided by the City under the California Public Records Act.
[ ] indicates a footnote.
[1] Totals are as provided by the City, except for the 7-Year grand total, those noted [2], and Cols. A, B and F.
[2] Annual total(s) in this row, or annual projection(s), except for Cols. D, E and F, are by highwayrobbery.net.
[3] Un-used columns are to allow for later expansion of City's system.
[4] Any figures in red type (or, if you are looking at this table in black and white, the upper figure when there are two or more figures in a cell) are what RedFlex calls Total Violations, or all incidents recorded by the cameras, and due to time limitations may have been posted here only for selected months or locations. If there is sufficient public interest, the remaining months will be posted. The figures in black type are what RedFlex calls Notices Printed, and represent the sum of genuine citations issued (those filed with the court) plus any Nominations mailed (not filed with the court, a.k.a. Snitch Tickets).
[5] The title bar has been repeated solely for the convenience of the reader -
there is no difference between it and the one near the top of the table.
[6] The camera enforcement is believed to be on traffic on the first-named street. The compass directions of enforcement shown are per invoices received from the City and information received from defendants.
[7] The official reports for these months were generated before or shortly after the end of the month and as a result, many violations were still "in progress" and the number of "approved violations" would be expected to grow from the number shown in the official report. Before being posted in the table above, the citywide totals given in the official monthly reports were adjusted to bring the total of the 12 individual months of the year up to the total shown in the official annual Customer Management Report (linked below).
[9] From official data received 10-24-09.
[10] From official data received 9-20-10.
[11] From official data received 11-4-11, with SEGV & SESL totals added manually.
[12] From official data received 2-10-12. For Oct. 2011 the official
data shows 2097 tickets issued at Slauson/Buckingham. The correct
number is 66 tickets issued.
[13] From official data received 2-18-12.
[14] From official data received 3-26-12, in which Mar. 2012 data is for 25 days.
[15] From official data received 11-7-12 and 11-8-12.
[16] From official data received 5-15-13.
[17] From official data received 8-2-13, with WACE data added.
[18] From official data received 12-31-13.
[19] From official data received 8-13-14.
[20] From official data received 10-20-14.
[21] From official data received 11-13-14.
[22] The new contract signed in Aug. 2014 expanded enforcement to right and/or left turns at many intersections. For details, see Exhibit "A" to the contract, which is available in Set # 7 of Culver City Documents.
[23] Official data has not been requested or received.
[24] These Fiscal Year totals, calculated by highwayrobbery.net, are totals of the monthly totals shown in the table above and in some cases (FY 11-12 and FY 12-13) are higher or lower than the Fiscal Year totals provided by the City.
[25] From official monthly and annual data received 2-23-15.
[26] From official data received 4-23-15.
[27] From official data received 4-27-15.
[28] From official data received 6-16-15.
[29] From official data received 12-22-15.
[30] From official data received 2-16-16.
[31] At the budget meeting of May 16, 2016 the police department told the city council that they would like to add cameras to these intersections. For details, see Set # 7 of Culver City Documents.
[32] From official data received 5-24-16.
[33] From official data received 7-18-16.
[34] From official data received 9-28-16
[35] From official data received 12-21-16
[36] From official data received 1-30-17
[37] From official data received 7-11-17
[38] The figures on this line are highwayrobbery.net's 12-month projections for the new cameras.
[39] The official Customer Management Report (CMR) for June 2017 shows zero activity for four cameras, while the Redflex Redlight Offender Statistics bar graph (see link below) for one of them, WACE-01, shows over 100 violations, which suggested that some tickets could have been generated by one or more of the four cameras and that citywide ticketing for June may have been higher than shown in the CMR. Highwayrobbery.net requested clarification and the City replied:
"The June RROS for WACE is showing activations because we are monitoring driver behavior at the discontinued approaches. Since 5/9/17, no citations have been issued at this intersection or the other three showing zeros (WASA, WAHE-01, WAHE-03) as these are the approaches that were discontinued."
[40] From official data received 10-17-17
[41] From the annual reports required, beginning with 2013, by CVC 21455.5(i). They become available by the Fall of the following year.
[42] Below is a graph of the monthly revenue figures seen in the rightmost column in the table above. For more info about monthly revenue, see Culver City Docs Set # 2 (which is on a separate webpage).
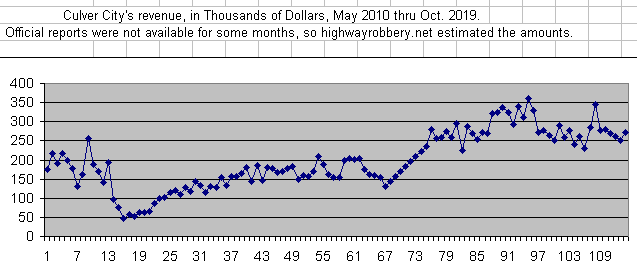
[43] From official data received 4-26-18
[44] From the CCPD Monthly Report, available on the City's website.
[45] From official data received 2-1-19
[46] From official data received 11-5-19
[47] From official data received 1-16-20
II. "Late Time" Bar Graphs
The City provided these bar graphs of Late Times.
These graphs track violations recorded, not tickets issued.
Where there is a large number of long Late Time violations in a curb lane, it is believed to indicate heavy ticketing on right turns.
(The curb lane will be the lane with the highest lane number.)
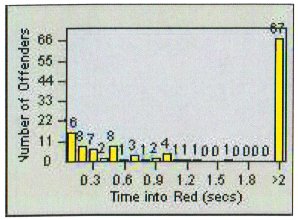
The picture above is an example from another city.
Jul03-Jun04 Bar Graphs
Jul08-Jun09 Bar Graphs
Oct11 Bar Graphs
Jun13 Bar Graphs
Jun14 Bar Graphs
Jan15 Bar Graphs
Oct15 Tabular Version
Jun17 Bar Graphs
---------------------------------
RED LIGHT CAMERAS
www.highwayrobbery.net
www.highwayrobbery.net