If
you haven't already done so, please read the
Beverly Hills section on the Camera Towns page
City of
Beverly Hills Documents
(and Information)
Beverly Hills, pop.
34,000, is 8 miles west of downtown Los
Angeles.
It is possible to completely ignore a Beverly
Hills red light camera ticket !
1. The Los Angeles County Superior Court does
not report ignored red light camera tickets to the
DMV. More info is in "Countywide Information,"
which is Docs Set # 2 on the LA
County Documents page.
2. If a "ticket" you received thru the US Mail does not have the Superior Court's name and address on it, it is a fake ticket, what I call a "Snitch Ticket." For more details about Snitch Tickets, see the Snitch Ticket section at the top of the Your Ticket page.
Yes, this is the webpage with a LOT of info about tickets from the red light cameras in Beverly Hills.
But first, this important political announcement ...
Vote No on Sheila Kuehl
Do you live in LA County? Was
Zev Yaroslavsky your County Supervisor? (Until
Nov. 2014, he represented the Third District, which
includes the central and western San Fernando Valley,
Malibu, Santa Monica, Venice, Beverly Hills, the City
of West Hollywood, and part of Hollywood.)

Sheila "Kuehl Cams" Kuehl, in 2007
During her career in the California
Legislature, Kuehl made three attempts to pass bills to
allow the use of automated speed enforcement (photo
radar) in California.
She also voted to put an additional LA County-wide sales tax, to go to Metro, on the Nov. 2016 ballot - and it passed. (See Measure M on the Action/Legis page, for more about that tax.)
Kuehl may be up for re-election in 2022.
It's rare for a city's local paper to
be critical of a city's actions, but on May 22, 2015 the
Beverly Hills Courier described the City as having "a
sour reputation as a red-light camera speed trap...."
Local Attractions Near
Beverly Hills' Red Light Cameras
Restaurants: Bouchon, Cut,
Mastro's Steakhouse, Matsuhisa, Maude, Red Medicine,
Scarpetta, Spago, Urusawa
Hotels: Hotel Bel Air, The
Beverly Hills Hotel, Beverly Wilshire, Four Seasons,
L'Ermitage, London West Hollywood, Mondrian, Montage,
Mr. C, Peninsula, SLS Hotel, Sofitel,
Sunset Marquis
Other: Rodeo Drive, The Grove,
Cedars-Sinai Medical Center, UCLA Medical Center
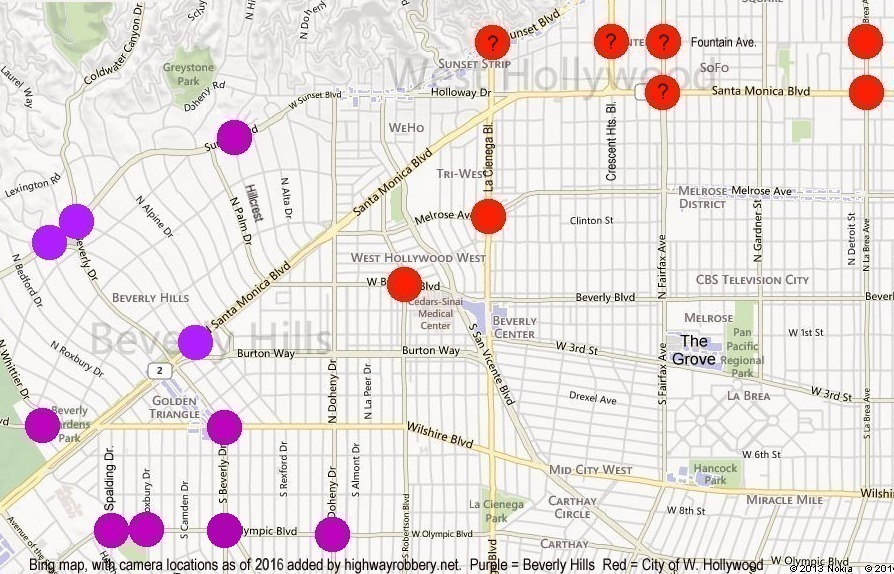
Map of Beverly Hills Cameras
(Purple Dots)
Map includes
New Beverly Hills Cameras Installed in June 2015
and May 2016, and the cameras in West Hollywood -
which were shut down in Feb. 2020.
The cameras in West Hollywood were shut down in Feb. 2020.
Beverly Hills Docs Set # 1
Ticket Counts
Total
Violations (in red
type), Citations Issued/Notices Printed (7)
Including
2003-2004 ACS/Xerox System, 2008 - 2014 RedFlex
System, and 2015 Onward Conduent (formerly called
ACS/Xerox) System
New 10-5-04,
updated 4-27-21
| ACS System Locations |
Wil- shire NB @ La Cien- ega |
Wil- shire SB @ La Cien- ega |
La Cien- ega EB @ Wil- shire |
La Cien- ega WB @ Wil- shire |
Olym- pic EB @ Spal- ding |
Olym- pic WB @ Spal- ding |
Sun- set EB @ Whit- tier |
Sun- set WB @ Whit- tier |
Sun- set EB @ Rex- ford |
Sun- set WB @ Rex- ford |
Sun- set EB @ Foot- hill |
Sun- set WB @ Foot- hill |
Olym- pic EB @ Cam- den |
Olym- pic WB @ Cam- den |
A Total Cites Issued (1) |
B |
C Total Camera Cites as Reported to the Traffic and Parking Comm. (5) |
D Total Signed Traffic Cites (non- camera) as Reported to the Traffic and Parking Comm. (5) |
E Total Citations Issued/ Rolling Right Citations Per CVC 21455.5(i) Annual Reports or Estimates (18) |
F Revenue from Court (thou- sands) (17) |
|||||||
| 2003 Avg. (4) |
9 |
17 |
3 |
24 |
41 |
15 |
25 |
44 |
- |
- |
- |
- |
- |
- |
|||||||||||||
| Jan04 |
7 |
11 |
2 |
21 |
69 |
18 |
38 |
36 |
- |
- |
- |
- |
- |
- |
202 |
||||||||||||
| Feb04 |
3 |
16 |
2 |
32 |
64 |
22 |
24 |
26 |
88 |
46 |
114 |
102 |
- |
- |
539 |
||||||||||||
| Mar04 |
4 |
12 |
4 |
15 |
66 |
25 |
28 |
68 |
106 |
77 |
131 |
139 |
- |
- |
675 |
||||||||||||
| Apr04 |
5 |
13 |
1 |
18 |
88 |
32 |
36 |
56 |
74 |
70 |
74 |
94 |
- |
- |
561 |
||||||||||||
| May04 |
- |
- |
- |
- |
97 |
29 |
38 |
66 |
96 |
71 |
79 |
78 |
- |
- |
554 |
||||||||||||
| Jun04 |
- |
- |
- |
- |
60 |
20 |
32 |
62 |
82 |
64 |
94 |
94 |
- |
- |
508 |
||||||||||||
| Jul04 |
- |
- |
- |
- |
47 |
13 |
37 |
56 |
85 |
64 |
125 |
110 |
62 |
66 |
665 |
||||||||||||
| Aug04 |
(12) |
||||||||||||||||||||||||||
| Sep04 |
(12) | ||||||||||||||||||||||||||
| Oct04 |
(12) | ||||||||||||||||||||||||||
| Nov04 |
(12) | ||||||||||||||||||||||||||
| Dec04 |
(12) | ||||||||||||||||||||||||||
| 2004 |
|||||||||||||||||||||||||||
| ACS System Ends |
|||||||||||||||||||||||||||
| RedFlex System Begins |
|||||||||||||||||||||||||||
| RedFlex Cam # (9) |
BEWI 01 |
OLDO 01 |
OLDO 03 |
OLRO 01 |
OLSP 01 |
SUHI 01 |
SUHI 03 |
WIWH 01 |
WIWH 03 |
||||||||||||||||||
| RedFlex System Locations |
Bev- erly Nbd @ Wil- shire |
Olym- pic Do- heny (8) |
Olym- pic Do- heny (8) |
Olym- pic Rox- bury (8) |
Olym- pic Spal- ding (8) |
Sun- set Hill- crest (8) |
Sun- set Hill- crest (8) |
Wil- shire Wbd @ Whit- tier |
Wil- shire Whit- tier (8) |
||||||||||||||||||
| Jan08 (11) |
0 0 |
244 92 |
251 85 |
0 0 |
0 0 |
0 0 |
0 0 |
631 338 |
916 336 |
2042 851 |
|||||||||||||||||
| Feb08 (11) |
|
1550 1009 |
|||||||||||||||||||||||||
| Mar08 (11) |
|
2007 1167 |
2022 1088 |
5254 2876 |
|||||||||||||||||||||||
| Apr08 (11) |
|
1737 1088 |
|||||||||||||||||||||||||
| May08 (11) |
|
1409 891 |
|||||||||||||||||||||||||
| Jun08 (11) |
|
1275 807 |
|||||||||||||||||||||||||
| Jul08 |
0 0 |
158 91 |
155 83 |
0 0 |
0 0 |
0 0 |
0 0 |
492 366 |
494 332 |
1299 872 |
|||||||||||||||||
| Aug08 (11) |
|
1276 823 |
|||||||||||||||||||||||||
| Sep08 (11) |
|
1234 921 |
|||||||||||||||||||||||||
| Oct08 (11) |
|
1329 1007 |
|||||||||||||||||||||||||
| Nov08 (11) |
|
1381 1040 |
|||||||||||||||||||||||||
| Dec08 (11) |
|
1199 902 |
|||||||||||||||||||||||||
| 2008 (2) |
20985 13087 |
||||||||||||||||||||||||||
| Jan09 |
53 0 |
146 87 |
144 88 |
178 0 |
94 5 |
279 0 |
123 8 |
487 369 |
511 387 |
2015 944 |
|||||||||||||||||
| Feb09 (11) |
|
2900 1230 |
|||||||||||||||||||||||||
| Mar09 (11) |
|
3447 1991 |
|||||||||||||||||||||||||
| Apr09 (11) |
|
2938 1880 |
|||||||||||||||||||||||||
| May09 (11) |
|
3093 2042 |
|||||||||||||||||||||||||
| Jun09 (11) |
|
2796 1806 |
|||||||||||||||||||||||||
| Jul09 |
1095 614 |
145 90 |
132 64 |
200 113 |
103 50 |
301 186 |
160 93 |
432 319 |
520 328 |
3088 1857 |
|||||||||||||||||
| Aug09 (11) |
|
2965 1737 |
|||||||||||||||||||||||||
| Sep09 (11) |
|
2817 1615 |
|||||||||||||||||||||||||
| Oct09 (11) |
|
2640 1690 |
|||||||||||||||||||||||||
| Nov09 (11) |
|
2390 1610 |
|||||||||||||||||||||||||
| Dec09 (11) |
|
2404 1644 |
|||||||||||||||||||||||||
| 2009 (2) |
33493 20046 |
|
|||||||||||||||||||||||||
| Jan10 |
671 411 |
84 47 |
99 51 |
132 78 |
65 42 |
205 137 |
138 99 |
433 326 |
408 301 |
2235 1492 |
|||||||||||||||||
| Feb10 (11) |
2242 1475 |
||||||||||||||||||||||||||
| Mar10 (11) |
2408 1445 |
||||||||||||||||||||||||||
| Apr10 (11) |
|
1959 1151 |
|||||||||||||||||||||||||
| May10 (11) |
2203 1298 |
160 |
|||||||||||||||||||||||||
| Jun10 (11) |
2655 1398 |
156 |
|||||||||||||||||||||||||
| Jul10 |
856 543 |
75 33 |
95 46 |
166 108 |
78 34 |
291 137 |
142 96 |
531 407 |
467 317 |
2707 1721 |
164 |
||||||||||||||||
| Aug10 (11) |
2850 1927 |
176 |
|||||||||||||||||||||||||
| Sep10 (11) |
2353 1583 |
190 |
|||||||||||||||||||||||||
| Oct10 (11) |
2319 1560 |
177 |
|||||||||||||||||||||||||
| Nov10 (11) |
2239 1604 |
139 |
|||||||||||||||||||||||||
| Dec10 (11) |
2121 1479 |
174 |
|||||||||||||||||||||||||
| 2010 (2) |
28291 18133 |
||||||||||||||||||||||||||
| Jan11 |
732 497 |
76 44 |
92 53 |
156 87 |
59 35 |
243 173 |
102 62 |
428 311 |
350 262 |
2238 1524 |
186 |
||||||||||||||||
| Feb11 (11) |
|
2344 1618 |
153 |
||||||||||||||||||||||||
| Mar11 (11) |
|
2462 1575 |
194 |
||||||||||||||||||||||||
| Apr11 |
770 448 |
81 48 |
107 60 |
169 95 |
61 26 |
240 151 |
152 82 |
421 311 |
447 322 |
2448 1543 |
184 |
||||||||||||||||
| May11 |
765 475 |
104 50 |
89 42 |
134 70 |
63 25 |
220 124 |
153 83 |
447 321 |
465 305 |
2440 1495 |
173 |
||||||||||||||||
| Jun11 |
883 536 |
35 40 |
100 52 |
145 78 |
86 37 |
265 155 |
168 81 |
439 332 |
383 254 |
2549 1565 |
173 |
||||||||||||||||
| Jul11 |
892 499 |
76 30 |
121 67 |
180 93 |
72 23 |
330 183 |
205 112 |
405 267 |
509 312 |
2790 1586 |
140 |
||||||||||||||||
| Aug11 |
952 463 |
127 50 |
96 47 |
214 93 |
96 33 |
333 162 |
195 98 |
487 276 |
477 296 |
2977 1518 |
117 |
||||||||||||||||
| Sep11 |
944 471 |
30 10 |
114 55 |
213 100 |
94 47 |
318 155 |
170 89 |
496 327 |
617 454 |
2976 1708 |
122 |
||||||||||||||||
| Oct11 |
989 518 |
135 53 |
134 74 |
209 107 |
134 65 |
371 203 |
193 104 |
518 353 |
646 453 |
3329 1930 |
121 |
||||||||||||||||
| Nov11 |
978 555 |
95 54 |
124 68 |
174 75 |
111 57 |
294 180 |
179 111 |
319 204 |
460 333 |
2734 1637 |
162 |
||||||||||||||||
| Dec11 |
1053 667 |
96 44 |
125 67 |
154 66 |
104 57 |
340 208 |
169 96 |
447 267 |
532 334 |
3020 1806 |
126 |
||||||||||||||||
| 2011 (2) |
32307 19505 |
||||||||||||||||||||||||||
| Jan12 |
892 461 |
81 43 |
118 80 |
182 55 |
88 46 |
314 174 |
149 64 |
432 271 |
324 216 |
2580 1410 |
171 |
||||||||||||||||
| Feb12 |
1010 349 |
94 30 |
107 29 |
194 44 |
74 25 |
314 126 |
165 44 |
492 245 |
549 262 |
2999 1154 |
134 |
||||||||||||||||
| Mar12 (11) |
223 65 |
2362 711 |
137 |
||||||||||||||||||||||||
| Apr12 (11) |
150 50 |
2482 991 |
110 |
||||||||||||||||||||||||
| May12 (11) |
167 38 |
2607 911 |
97 |
||||||||||||||||||||||||
| Jun12 (11) |
185 51 |
2740 1058 |
102 |
||||||||||||||||||||||||
| Jul12 (11) |
339 157 |
2882 1162 |
96 |
||||||||||||||||||||||||
| Aug12 |
374 201 |
155 71 |
190 79 |
323 52 |
127 48 |
356 147 |
123 47 |
604 269 |
757 451 |
3009 1365 |
107 |
||||||||||||||||
| Sep12 |
387 202 |
141 58 |
211 85 |
277 44 |
125 68 |
349 137 |
208 73 |
745 314 |
632 380 |
3075 1361 |
91 |
||||||||||||||||
| Oct12 (11) |
1984 656 |
113 |
|||||||||||||||||||||||||
| Nov12 (11) |
2426 1361 |
88 |
|||||||||||||||||||||||||
| Dec12 (11) |
2386 1333 |
90 |
|||||||||||||||||||||||||
| 2012 (2) |
31532 13473 |
||||||||||||||||||||||||||
| Jan13 (11) |
2431 1482 |
118 |
|||||||||||||||||||||||||
| Feb13 (11) |
2737 1553 |
112 |
|||||||||||||||||||||||||
| Mar13 (11) |
3071 1546 |
141 |
|||||||||||||||||||||||||
| Apr13 (11) |
2968 1489 |
166 |
|||||||||||||||||||||||||
| May13 (11) |
|
3199 1506 |
160 |
||||||||||||||||||||||||
| Jun13 (11) |
2998 1377 |
127 |
|||||||||||||||||||||||||
| Jul13 |
409 201 |
186 79 |
234 106 |
148 47 |
163 88 |
409 189 |
199 58 |
472 255 |
796 410 |
3016 1433 |
131 |
||||||||||||||||
| Aug13 (11) |
1779 796 |
129 |
|||||||||||||||||||||||||
| Sep13 (11) |
1568 801 |
116 |
|||||||||||||||||||||||||
| Oct13 (11) |
2951 1693 |
88 |
|||||||||||||||||||||||||
| Nov13 (11) |
2559 1531 |
96 |
|||||||||||||||||||||||||
| Dec13 (11) |
2614 1657 |
127 |
|||||||||||||||||||||||||
| 2013 (2) |
31891 16864 |
14435 2483 |
|||||||||||||||||||||||||
| Jan14 (11) |
2367 1481 |
1481 |
140 |
||||||||||||||||||||||||
| Feb14 (11) |
2517 1451 |
1502 |
124 |
||||||||||||||||||||||||
| Mar14 |
408 211 |
161 98 |
191 72 |
175 67 |
200 125 |
405 232 |
240 95 |
541 320 |
701 421 |
3022 1641 |
1724 |
144 |
|||||||||||||||
| Apr14 |
382 164 |
147 78 |
190 61 |
202 72 |
184 112 |
231 119 |
145 45 |
332 175 |
542 316 |
2355 1142 |
1085 |
131 |
|||||||||||||||
| May14 (11) |
2620 1206 |
1468 |
108 |
||||||||||||||||||||||||
| Jun14 |
345 191 |
133 67 |
221 94 |
171 80 |
169 96 |
263 128 |
178 64 |
428 248 |
548 291 |
2456 1259 |
1435 |
94 |
|||||||||||||||
| Jul14 |
2731 1285 |
1464 |
83 |
||||||||||||||||||||||||
| Aug14 |
328 190 |
159 106 |
150 77 |
260 112 |
194 134 |
368 214 |
223 88 |
619 392 |
613 430 |
2914 1743 |
1560 |
112 |
|||||||||||||||
| Sep14 |
2695 1527 |
1527 |
131 |
||||||||||||||||||||||||
| Oct14 |
1214 694 |
805 |
119 |
||||||||||||||||||||||||
| Nov14 |
No Cams |
77 |
|||||||||||||||||||||||||
| Dec14 |
No Cams | 43 |
|||||||||||||||||||||||||
| 2014 (2) |
16962 (proj.) |
16861 (proj.) |
11566 1983 |
||||||||||||||||||||||||
| RedFlex System Ends |
|||||||||||||||||||||||||||
| Xerox/ Conduent System Begins |
|||||||||||||||||||||||||||
| Xerox/ Conduent Cam # (9) |
6031 |
6084 |
6083 |
6074 |
6063 |
6024 |
6023 |
6044 |
6043 |
6053 |
6054 |
6001 |
6002 |
6011 |
6012 |
6093 |
6094 |
A |
B |
C |
D |
E |
F |
||||
| System Locations (10) |
Bev- erly Nbd @ Wil- shire |
Olym- pic Wbd @ Do- heny |
Olym- pic Ebd @ Do- heny |
Olym- pic Wbd @ Rox- bury |
Olym- pic Ebd @ Spal- ding |
Sun- set Wbd @ Hill- crest |
Sun- set Ebd @ Hill- crest |
Wil- shire Wbd @ Whit- tier (13) |
Wil- shire Ebd @ Whit- tier (13) |
Santa Mon -ica Ebd @ Cres -cent (14) |
Santa Mon -ica Wbd @ Cres -cent (14) |
Bene -dict Cyn. Nbd @ Sun -set (14) |
Bene -dict Cyn. Sbd @ Sun -set (14) |
Cres -cent Dr. Nbd @ Sun -set (14) (16) |
Cres -cent/ Cold- water/ Bev- erly Sbd @ Sun -set (14) (16) |
Olym- pic Ebd @ Bev- erly (15) (19) (20) |
Olym- pic Wbd @ Bev- erly (15) (19) |
Events, Possible Violations, Total Cites Mailed (not incl. warnings) per Reports Linked Below (2) (7) |
Total Cites Mailed (not incl. cam 6093) |
Total Camera Cites as Reported to the City's Traffic and Parking Comm. (5) |
Total Signed Traffic Cites (non- camera) as Reported to the City's Traffic and Parking Comm. (5) |
Total Citations Issued/ Rolling Right Citations Per CVC 21455.5(i) Annual Reports or Estimates (18) |
Revenue from Court (thou- sands) (17) |
||||
| Jan15 |
No Cams | 864 |
35 |
||||||||||||||||||||||||
| Feb15 |
No Cams | 741 |
21 |
||||||||||||||||||||||||
| Mar15 |
No Cams | 835 |
28 |
||||||||||||||||||||||||
| Apr15 |
No Cams | 986 |
26 |
||||||||||||||||||||||||
| May15 |
No Cams | 1009 |
61 |
||||||||||||||||||||||||
| Jun15 |
391 234TS 90 40W 0 |
242 81TS 40 23W 0 |
236 88TS 41 24W 0 |
446 138TS 41 56W 0 |
262 69TS 93 46W 0 |
779 73TS 122 50W 0 |
495 96TS 118 69W 0 |
113 69TS 36 22W 0 |
443 74TS 99 51W 0 |
36 36TS 0 0W 0 |
129 72TS 12 4W 0 |
3572 1030TS 721 385W 0 |
1029 |
84 |
|||||||||||||
| Jul15 |
324 139TS 89 36W 0 |
262 112TS 40 3W 8 |
261 126TS 49 5W 4 |
505 227TS 86 8W 11 |
262 173TS 26 0W 4 |
834 121TS 108 9W 13 |
575 129TS 135 13W 21 |
246 108TS 90 10W 17 |
420 106TS 105 14W 8 |
352 164TS 26 7W 0 |
388 182TS 50 13W 0 |
229 200TS 9 5W 0 |
317 123TS 20 4W 0 |
247 195TS 18 11W 0 |
210 208TS 1 0W 0 |
5432 2313TS 852 138W 86 |
204 |
799 |
31 |
||||||||
| Aug15 |
519 205TS 174 62W 0 |
291 125TS 59 0W 11 |
282 156TS 47 0W 20 |
385 155TS 92 0W 36 |
285 108TS 64 0W 36 |
744 119TS 113 0W 36 |
527 130TS 111 0W 41 |
242 132TS 76 0W 28 |
478 110TS 126 0W 28 |
807 156TS 110 48W 0 |
630 110TS 151 85W 0 |
187 137TS 15 3W 0 |
387 116TS 33 14W 0 |
264 162TS 48 34W 0 |
152 143TS 1 1W 0 |
6180 2064TS 1220 247W 236 |
630 |
1037 |
24 |
||||||||
| Sep15 (11) |
6096 1842TS 1267 0W 384 |
504 |
928 |
27 |
|||||||||||||||||||||||
| Oct15 (11) |
6331 1699TS 1316 0W 402 |
514 |
696 |
30 |
|||||||||||||||||||||||
| Nov15 (11) |
6007 1740TS 1288 0W 392 |
477 |
449 |
27 |
|||||||||||||||||||||||
| Dec15 (11) |
5868 1675TS 1167 0W 654 |
743 |
512 |
24 |
|||||||||||||||||||||||
| 2015 (2) |
- - 4308 (proj.) |
6144 (proj.) |
9885 |
2581 439 |
|||||||||||||||||||||||
| Avg Red |
|||||||||||||||||||||||||||
| Jan16 (11) |
5961 1725TS 1296 0W 696 |
696 |
772 |
639 |
32 |
||||||||||||||||||||||
| Feb16 (11) |
6494 1646TS 1462 0W 855 |
855 |
955 |
646 |
40 |
||||||||||||||||||||||
| Mar16 |
565 215TS 207 0W 119 |
337 108TS 127 0W 73 |
285 103TS 83 0W 50 |
327 115TS 80 0W 56 |
473 102TS 83 0W 54 |
1020 107TS 115 0W 69 |
688 131TS 135 0W 75 |
242 108TS 110 0W 57 |
584 107TS 139 0W 87 |
658 169TS 136 0W 88 |
596 113TS 219 0W 126 |
256 126TS 23 0W 10 |
423 108TS 53 0W 30 |
174 107TS 49 0W 38 |
138 105TS 10 0W 7 |
|
|
6766 1824TS 1569 0W 939 |
939 |
781 |
597 |
48 |
|||||
| Apr16 |
567 277TS 171 0W 107 |
351 66TS 145 0W 94 |
292 78TS 117 0W 59 |
392 116TS 109 0W 81 |
463 96TS 78 0W 51 |
1002 99TS 55 0W 54 |
760 113TS 104 0W 59 |
235 104TS 93 0W 52 |
574 95TS 155 0W 95 |
608 198TS 112 0W 68 |
503 100TS 182 0W 97 |
241 108TS 12 0W 6 |
431 96TS 48 0W 33 |
159 100TS 44 0W 31 |
125 99TS 9 0W 8 |
498 141TS 33 1W 0 |
404 172TS 22 0W 0 |
7605 2058TS 1539 1W 895 |
895 |
1003 |
468 |
55 |
|||||
| May16 (11) |
953 178TS 425 298W 0 |
1357 212TS 257 125W 0 |
8585 2197TS 2132 423W 861 |
861 |
1297 |
805 |
63 |
||||||||||||||||||||
| Jun16 |
866 572TS 182 0W 100 |
324 78W 130 0W 97 |
286 91TS 80 0W 57 |
431 173TS 91 0W 56 |
507 111TS 71 0W 48 |
844 121TS 106 0W 58 |
855 123TS 119 0W 58 |
221 112TS 87 0W 50 |
412 107TS 125 0W 73 |
608 192TS 98 0W 63 |
575 115TS 195 0W 132 |
256 111TS 12 0W 5 |
438 106TS 40 0W 24 |
171 108TS 37 0W 29 |
135 104TS 12 0W 8 |
892 190TS 403 33W 243 |
1369 256TS 246 6W 118 |
9190 2670TS 2034 39W 1219 |
976 |
1207 |
629 |
71 |
|||||
| Jul16 (11) |
882 376 277 |
1301 242 132 |
9505 2814TS 2014 0W 1361 |
1084 |
1388 |
628 |
79 |
||||||||||||||||||||
| Aug16 (11) |
882 384 283 |
897 222 127 |
9706 3112TS 2198 0W 1453 |
1170 |
1419 |
727 |
99 |
||||||||||||||||||||
| Sep16 (11) |
803 374 285 |
1068 172 99 |
9067 2465TS 1922 0W 1251 |
966 |
1393 |
1173 |
101 |
||||||||||||||||||||
| Oct16 (11) |
746 357 280 |
1267 132 70 |
9408 2308TS 1996 0W 1350 |
1070 |
1312 |
538 |
92 |
||||||||||||||||||||
| Nov16 (11) |
726 308 255 |
1107 138 82 |
8721 1810 1273 |
1018 |
1246 |
799 |
105 |
||||||||||||||||||||
| Dec16 (11) |
757 295 222 |
1283 115 84 |
8754 1650 1191 |
969 |
1168 |
777 |
99 |
||||||||||||||||||||
| 2016 (2) |
- - 1313 |
- - 1035 |
- - 628 |
- - 664 |
- - 632 |
- - 785 |
- - 888 |
- - 668 |
- - 1073 |
- - 822 |
- - 1359 |
- - 120 |
- - 400 |
- - 414 |
- - 79 |
- - 1845 |
- - 848 |
99762 21622 13344 |
11499 |
13941 |
8426 |
13911 2365 |
884 |
||||
| Avg. Red (22) |
|||||||||||||||||||||||||||
| Cam # (9) |
6031 |
6084 |
6083 |
6074 |
6063 |
6024 |
6023 |
6044 |
6043 |
6053 |
6054 |
6001 |
6002 |
6011 |
6012 |
6093 |
6094 |
A |
B |
C |
D |
E |
F |
||||
| Jan17 |
- 184 146 |
- 121 92 |
- 91 63 |
- 78 69 |
- 64 50 |
- 117 91 |
- 143 99 |
- 89 73 |
- 139 115 |
- 110 86 |
- 126 88 |
- 10 5 |
- 56 44 |
- 42 36 |
- 13 9 |
846 410 348 |
1304 123 92 |
8865 1916 1506 |
1158 |
1094 |
610 |
102 |
|||||
| Feb17 |
- 173 117 |
- 93 72 |
- 57 42 |
- 62 46 |
- 49 37 |
- 104 78 |
- 120 83 |
- 60 40 |
- 104 71 |
- 104 71 |
- 115 74 |
- 16 9 |
- 41 29 |
- 35 29 |
- 8 7 |
571 224 121 |
1168 70 48 |
7865 1435 974 |
853 |
955 |
709 |
94 |
|||||
| Mar17 |
- 205 132 |
- 131 104 |
- 81 63 |
- 94 69 |
- 61 51 |
- 125 94 |
- 154 112 |
- 124 84 |
- 152 105 |
- 199 93 |
- 209 136 |
- 27 20 |
- 57 35 |
- 63 49 |
- 6 5 |
1079 667 559 |
1333 109 72 |
10417 2464 1783 |
1224 |
1551 |
818 |
120 |
|||||
| Apr17 |
- 164 81 |
- 114 89 |
- 64 47 |
- 92 74 |
- 61 50 |
- 149 82 |
- 119 78 |
- 78 54 |
- 147 113 |
- 122 72 |
- 159 104 |
- 14 10 |
- 55 34 |
- 52 40 |
- 9 9 |
1087 671 566 |
1260 92 53 |
9762 2162 1556 |
990 |
1596 |
516 |
115 |
|||||
| May17 |
- 209 138 |
- 142 115 |
- 74 59 |
- 86 68 |
- 79 59 |
- 120 96 |
- 189 137 |
- 86 56 |
- 165 136 |
- 145 96 |
- 174 123 |
- 28 20 |
- 61 48 |
- 70 55 |
- 6 4 |
1196 798 692 |
1453 112 75 |
10391 2544 1977 |
1285 |
1597 |
606 |
124 |
|||||
| Jun17 |
- 226 136 |
- 141 106 |
- 88 68 |
- 75 60 |
- 81 68 |
- 135 105 |
- 174 128 |
- 101 46 |
- 148 111 |
- 193 128 |
- 137 81 |
- 21 14 |
- 61 45 |
- 66 58 |
- 10 9 |
1216 782 663 |
1505 122 85 |
10393 2561 1911 |
1248 |
1233 |
702 |
135 |
|||||
| Jul17 |
- 233 148 |
- 159 115 |
- 111 78 |
- 122 97 |
- 117 88 |
- 300 206 |
- 259 173 |
- 140 101 |
- 303 216 |
- 258 169 |
- 213 147 |
- 29 19 |
- 119 80 |
- 82 62 |
- 17 11 |
1322 910 769 |
1563 128 95 |
10643 3500 2574 |
1805 |
2110 |
896 |
135 |
|||||
| Aug17 |
- 243 176 |
- 159 114 |
- 123 91 |
- 121 94 |
- 125 96 |
- 259 183 |
- 247 165 |
- 145 106 |
- 261 188 |
- 231 147 |
- 231 137 |
-- 45 32 |
- 95 68 |
- 112 79 |
- 10 8 |
1297 875 706 |
1375 163 101 |
12648 3445 2491 |
1785 |
2120 |
970 |
152 |
|||||
| Sep17 |
- 204 136 |
- 145 100 |
- 69 51 |
- 93 62 |
- 85 63 |
- 217 123 |
- 244 140 |
- 118 86 |
- 235 163 |
- 228 121 |
- 235 147 |
- 25 11 |
- 80 45 |
- 60 49 |
- 18 12 |
1197 807 680 |
1450 113 73 |
12240 2976 2062 |
1382 |
2491 |
589 |
145 |
|||||
| Oct17 |
- 258 175 |
- 174 125 |
- 86 54 |
- 102 70 |
- 103 78 |
- 189 115 |
- 280 192 |
- 101 68 |
- 220 158 |
- 158 98 |
- 144 105 |
- 39 17 |
- 65 47 |
- 59 36 |
- 12 8 |
1245 845 720 |
1648 101 65 |
10216 2936 2131 |
1401 |
1739 |
478 |
155 |
|||||
| Nov17 |
- 174 128 |
- 127 86 |
- 66 51 |
- 75 61 |
- 62 51 |
- 67 53 |
- 110 91 |
- 89 70 |
- 152 114 |
- 117 63 |
- 175 111 |
- 19 13 |
- 60 38 |
- 60 46 |
- 9 6 |
977 601 486 |
1480 95 61 |
9085 2058 1529 |
1043 |
1444 |
605 |
141 |
|||||
| Dec17 |
- 222 159 |
- 142 108 |
- 91 71 |
- 106 72 |
- 87 72 |
- 37 26 |
- 77 61 |
- 120 82 |
- 210 151 |
- 152 80 |
- 240 167 |
- 24 18 |
- 82 67 |
- 64 51 |
- 6 5 |
1363 912 745 |
1468 121 85 |
9305 2693 2020 |
1275 |
2020 |
428 |
121 |
|||||
| 2017 (2) |
- 2495 1672 |
- 1648 1226 |
- 1001 738 |
- 1106 842 |
- 974 763 |
- 1819 1252 |
- 2116 1459 |
- 1251 866 |
- 2236 1641 |
- 2017 1224 |
- 2158 1420 |
- 297 188 |
- 832 580 |
- 765 590 |
- 124 93 |
13396 8502 7055 |
17007 1349 905 |
121830 30690 22504 |
15449 |
19950 |
7927 |
1539 |
|||||
| Avg. Red (22) |
13.7 |
2.6 |
3.1 |
1.3 |
2.4 |
55.3 |
33.5 |
2.4 |
4.4 |
37.1 |
24.8 |
7.9 |
7.8 |
4.2 |
5.0 |
1.5 |
9.3 |
12.7 |
|||||||||
| Right Turn
Tickets, Est. (18) |
596 |
70 |
52 |
18 |
39 |
1252 |
1301 |
44 |
173 |
1211 |
933 |
38 |
114 |
59 |
11 |
191 |
215 |
7420 |
22504 6318 |
||||||||
| Jan18 |
- 180 124 |
- 113 87 |
- 71 48 |
- 87 68 |
- 75 57 |
- 8 7 |
- 16 11 |
- 79 58 |
- 156 93 |
- 128 78 |
- 191 129 |
- 23 15 |
- 68 39 |
- 101 74 |
- 12 10 |
1241 787 679 |
1410 78 46 |
9065 2173 1623 |
944 |
1623 |
427 |
142 |
|||||
| Feb18 |
- 188 137 |
- 143 106 |
- 60 38 |
- 76 56 |
- 66 52 |
- 3 0 |
- 3 3 |
- 98 72 |
- 167 120 |
- 127 73 |
- 192 130 |
- 43 27 |
- 70 47 |
- 57 47 |
- 18 12 |
1102 705 591 |
1290 79 55 |
8287 2095 1566 |
975 |
1488 |
553 |
122 |
|||||
| Mar18 |
- 213 138 |
- 114 81 |
- 59 34 |
- 80 58 |
- 44 36 |
- 32 15 |
- 30 13 |
- 103 80 |
- 187 131 |
- 145 85 |
- 210 104 |
- 33 23 |
- 61 44 |
- 38 30 |
- 12 8 |
1175 783 643 |
1555 85 45 |
9410 2229 1568 |
925 |
1474 |
400 |
137 |
|||||
| Apr18 (20) |
- 197 130 |
- 114 77 |
- 70 53 |
- 96 76 |
- 80 61 |
- 58 22 |
- 50 29 |
- 109 80 |
- 202 146 |
- 123 72 |
- 232 128 |
- 28 20 |
- 54 39 |
- 61 43 |
- 16 14 |
411 317 282 |
302 30 25 |
7280 1837 1297 |
1015 |
1298 |
666 |
126 |
|||||
| May18 (20) |
- 198 140 |
- 134 98 |
- 70 44 |
- 81 61 |
- 92 72 |
- 40 27 |
- 42 30 |
- 102 78 |
- 231 148 |
- 144 75 |
- 257 164 |
- 23 14 |
- 73 44 |
- 88 67 |
- 11 5 |
1054 58 56 |
297 8 6 |
7987 1652 1129 |
1073 |
1129 |
678 |
103 |
|||||
| Jun18 |
- 219 148 |
- 141 92 |
- 97 72 |
- 74 55 |
- 107 84 |
- 56 37 |
- 62 42 |
- 115 87 |
- 254 173 |
- 181 96 |
- 249 156 |
- 36 24 |
- 70 37 |
- 96 73 |
- 9 8 |
1967 311 221 |
1116 81 42 |
9990 2158 1447 |
1226 |
1363 |
428 |
85 |
|||||
| Jul18 |
- 204 106 |
- 120 83 |
- 69 41 |
- 69 39 |
- 81 54 |
- 124 81 |
- 132 79 |
- 122 79 |
- 213 149 |
- 176 102 |
- 220 117 |
- 24 12 |
- 77 38 |
- 70 50 |
- 12 8 |
612 314 143 |
1135 91 66 |
8328 2118 1247 |
1104 |
1365 |
478 |
86 |
|||||
| Aug18 |
- 241 154 |
- 171 122 |
- 128 101 |
- 108 82 |
- 94 74 |
- 162 115 |
- 186 128 |
- 152 111 |
- 201 141 |
- 152 96 |
- 232 158 |
- 25 15 |
- 108 75 |
- 97 65 |
- 12 7 |
456 193 151 |
811 85 55 |
6551 2347 1650 |
1499 |
1651 |
611 |
137 |
|||||
| Sep18 |
- 199 123 |
- 138 97 |
- 71 52 |
- 62 47 |
- 82 54 |
- 111 72 |
- 113 73 |
- 120 75 |
- 228 161 |
- 132 79 |
- 154 89 |
- 22 16 |
- 61 40 |
- 66 43 |
- 13 8 |
428 182 147 |
917 70 45 |
5907 1824 1221 |
1074 |
1221 |
675 |
127 |
|||||
| Oct18 |
- 207 131 |
- 137 92 |
- 85 60 |
- 76 51 |
- 84 65 |
- 121 72 |
- 163 96 |
- 118 78 |
- 197 144 |
- 105 71 |
- 164 109 |
- 28 13 |
- 65 43 |
- 80 56 |
- 3 1 |
480 218 171 |
916 90 59 |
7480 1941 1312 |
1141 |
1314 |
502 |
196 |
|||||
| Nov18 |
- 184 124 |
- 130 101 |
- 88 66 |
- 62 50 |
- 81 60 |
- 96 69 |
- 148 108 |
- 99 77 |
- 199 144 |
- 87 54 |
- 148 99 |
- 23 16 |
- 70 45 |
- 57 41 |
- 10 7 |
719 405 301 |
952 119 45 |
7816 2006 1407 |
1106 |
1412 |
355 |
85 |
|||||
| Dec18 |
- 218 159 |
- 131 103 |
- 91 71 |
- 67 50 |
- 82 68 |
- 128 94 |
- 149 114 |
- 117 93 |
- 208 166 |
- 120 93 |
- 175 128 |
- 32 22 |
- 64 38 |
- 113 100 |
- 9 6 |
891 571 495 |
1120 64 39 |
7942 2339 1839 |
1344 |
1848 |
369 |
90 |
|||||
| 2018 (1) |
- 2442 1614 |
- 1579 1139 |
- 959 680 |
- 933 693 |
- 964 737 |
- 936 611 |
- 1092 726 |
- 1336 968 |
- 2435 1715 |
- 1615 974 |
- 2416 1510 |
- 339 217 |
- 839 529 |
- 915 689 |
- 136 94 |
10508 4807 3878 |
11839 877 528 |
98542 24620 17302 |
13424 |
17186 |
6142 |
1436 |
|||||
| Avg. Red (22) |
23.8 |
3.2 |
3.6 |
1.7 |
2.5 |
29.6 |
13.5 |
1.9 |
3.8 |
22.9 |
21.5 |
9.2 |
8.5 |
3.2 |
4.7 |
2.0 |
9.9 |
9.3 |
|||||||||
| Right Turn Tickets, Est. (18) | 1567 |
128 |
88 |
35 |
61 |
598 |
393 |
56 |
236 |
909 |
1321 |
79 |
176 |
78 |
16 |
242 |
207 |
6344 |
17302 6191 |
||||||||
| Jan19 |
- 176 121 |
- 131 103 |
- 71 58 |
- 75 54 |
- 77 59 |
- 87 74 |
- 138 109 |
- 99 69 |
- 171 141 |
- 87 57 |
- 140 96 |
- 24 16 |
- 64 44 |
- 58 44 |
- 3 2 |
855 528 451 |
1082 79 45 |
7503 2008 1549 |
1098 |
1447 |
400 |
140 |
|||||
| Avg. Red (22) |
26.0 |
3.4 |
3.1 |
1.8 |
2.4 |
39.5 |
23.5 |
0.8 |
2.3 |
16.6 |
38.7 |
17.1 |
7.0 |
4.4 |
1.3 |
2.3 |
13.4 |
12.0 |
|||||||||
| Feb19 |
- 152 110 |
- 123 100 |
- 64 55 |
- 64 52 |
- 81 68 |
- 102 79 |
- 176 136 |
- 131 98 |
- 147 119 |
- 101 70 |
- 140 91 |
- 19 14 |
- 39 32 |
- 44 33 |
- 4 4 |
787 485 414 |
950 76 53 |
7058 1948 1528 |
1114 |
1192 |
313 |
88 |
|||||
| Avg. Red (22) |
11.4 |
3.4 |
1.9 |
0.9 |
2.4 |
47.9 |
18.5 |
1.0 |
2.2 |
10.5 |
33.4 |
4.2 |
5.6 |
4.3 |
1.3 |
27.0 |
11.8 |
11.0 |
|||||||||
| Mar19 |
- 181 134 |
- 128 97 |
- 81 58 |
- 71 57 |
- 79 66 |
- 212 93 |
- 151 118 |
- 148 126 |
- 169 134 |
- 75 54 |
- 128 93 |
- 24 16 |
- 50 36 |
- 53 36 |
- 9 8 |
877 549 493 |
996 61 44 |
8310 2169 1663 |
1170 |
1668 |
678 |
113 |
|||||
| Avg. Red (22) |
15.4 |
3.5 |
3.7 |
1.6 |
3.2 |
63.0 |
41.8 |
1.0 |
2.7 |
14.3 |
53.1 |
4.1 |
7.6 |
3.3 |
0.5 |
2.0 |
10.5 |
13.7 |
|||||||||
| Apr19 (21) |
- 154 130 |
- 137 123 |
- 96 77 |
- 72 60 |
- 88 72 |
- 123 103 |
- 165 130 |
- 133 116 |
- 211 170 |
- 97 66 |
- 165 123 |
- 17 14 |
- 56 48 |
- 64 57 |
- 14 13 |
907 599 547 |
984 52 45 |
8136 2243 1894 |
1347 |
1897 |
853 |
140 |
|||||
| Avg. Red (22) |
14.5 |
2.4 |
2.1 |
0.9 |
2.5 |
42.9 |
19.8 |
1.2 |
4.2 |
21.1 |
13.8 |
12.6 |
4.4 |
4.1 |
3.9 |
1.9 |
8.0 |
9.4 |
|||||||||
| May19 (21) |
- 124 93 |
- 126 99 |
- 63 53 |
- 75 62 |
- 91 83 |
- 108 92 |
- 144 119 |
- 118 102 |
- 184 149 |
- 86 67 |
- 131 115 |
- 25 22 |
- 47 35 |
- 63 51 |
- 6 5 |
905 557 515 |
1127 74 57 |
8666 2022 1719 |
1204 |
1720 |
617 |
123 |
|||||
| Avg. Red (22) |
27.9 |
2.4 |
3.2 |
2.9 |
3.2 |
40.3 |
54.3 |
1.8 |
3.4 |
31.5 |
40.3 |
4.4 |
5.9 |
4.2 |
1.0 |
1.5 |
11.6 |
14.1 |
|||||||||
| Jun19 (21) |
- 147 102 |
- 125 103 |
- 72 61 |
- 63 53 |
- 88 73 |
- 125 104 |
- 138 110 |
- 97 88 |
- 171 136 |
- 88 68 |
- 147 118 |
- 29 21 |
- 62 51 |
- 74 63 |
- 8 7 |
931 543 480 |
1099 70 55 |
8506 2047 1692 |
1212 |
1692 |
393 |
119 |
|||||
| Avg. Red (22) |
13.9 |
2.6 |
4.7 |
1.2 |
1.6 |
36.3 |
29.7 |
0.9 |
2.9 |
42.6 |
12.7 |
5.7 |
8.4 |
2.7 |
10.8 |
1.4 |
12.9 |
11.2 |
|||||||||
| Jul19 |
- 131 97 |
- 186 159 |
- 99 93 |
- 93 87 |
- 106 93 |
- 129 115 |
- 165 134 |
- 144 127 |
- 221 177 |
- 73 58 |
- 163 120 |
- 27 22 |
- 79 63 |
- 82 76 |
- 14 12 |
1084 712 615 |
1141 96 74 |
8429 2520 2122 |
1507 |
2125 |
436 |
128 |
|||||
| Avg. Red (22) |
8.9 |
2.4 |
2.5 |
1.5 |
1.7 |
13.0 |
34.9 |
1.2 |
3.4 |
15.4 |
4.9 |
8.2 |
6.3 |
3.3 |
2.5 |
1.6 |
13.0 |
7.3 |
|||||||||
| Aug19 (11) |
869 512 444 |
1091 57 45 |
7993 1840 1461 |
1017 |
1461 |
768 |
96 |
||||||||||||||||||||
| Avg. Red (22) | 1.5 |
11.0 |
7.5 |
||||||||||||||||||||||||
| Sep19 (11) |
932 580 496 |
947 45 31 |
7168 1874 1583 |
1087 |
1585 |
957 |
87 |
||||||||||||||||||||
| Avg. Red (22) | 1.7 |
8.1 |
12.6 |
||||||||||||||||||||||||
Oct19 |
- 99 81 |
- 134 110 |
- 86 73 |
- 96 72 |
- 85 69 |
- 83 67 |
- 139 105 |
- 71 52 |
- 181 146 |
- 62 35 |
- 124 99 |
- 33 27 |
- 79 66 |
- 68 59 |
- 12 11 |
851 534 466 |
526 102 76 |
7377 1988 1614 |
1148 |
1615 |
648 |
111 |
|||||
| Avg. Red (22) |
24.9 |
4.0 |
3.5 |
1.5 |
3.0 |
48.0 |
26.2 |
2.6 |
4.0 |
8.6 |
16.8 |
8.8 |
4.1 |
2.5 |
5.0 |
1.8 |
11.4 |
10.4 |
|||||||||
| Nov19 (11) |
830 533 481 |
469 124 90 |
6998 2202 1873 |
1392 |
1873 |
474 |
|||||||||||||||||||||
| Avg. Red (22) | 1.9 |
12.4 |
12.7 |
||||||||||||||||||||||||
| Dec19 (11) |
756 450 415 |
451 67 53 |
6937 1792 1532 |
1117 |
1514 |
421 |
|||||||||||||||||||||
| Avg. Red (22) | 1.6 |
13.6 |
13.9 |
||||||||||||||||||||||||
| 2019 (1) |
- - 1157 |
- - 1322 |
- - 819 |
- - 735 |
- - 902 |
- - 1026 |
- - 1416 |
- - 1108 |
- - 1777 |
- - 631 |
- - 1265 |
- - 235 |
- - 580 |
- - 667 |
- - 105 |
10584 6582 5816 |
10863 903 668 |
93081 24653 20229 |
14413 |
19789 |
6958 |
1374 (proj.) |
|||||
| Avg. Red (22) (23) |
11.3 |
||||||||||||||||||||||||||
| Right Turn Tickets, Est. (18) | |||||||||||||||||||||||||||
| Jan20 (11) |
729 414 382 |
518 92 68 |
7004 1822 1496 |
1114 |
1496 |
815 |
|||||||||||||||||||||
| Avg. Red (22) | 1.7 |
13.7 |
13.4 |
||||||||||||||||||||||||
| Feb20 (11) |
730 426 387 |
398 65 45 |
6163 1675 1376 |
989 |
1377 |
667 |
|||||||||||||||||||||
| Avg. Red (22) | 1.4 |
9.4 |
11.1 |
||||||||||||||||||||||||
Mar20 |
- 1 1 |
- 94 78 |
- 67 58 |
- 59 48 |
- 78 65 |
- 85 61 |
- 123 101 |
- 116 94 |
- 161 150 |
- 65 50 |
- 122 86 |
- 23 19 |
- 53 44 |
- 53 47 |
- 8 7 |
733 381 347 |
450 79 60 |
6089 1568 1316 |
969 |
1316 |
346 |
||||||
| Avg. Red (22) | 0.0 |
4.1 |
5.0 |
3.0 |
2.9 |
134.7 |
102.3 |
1.3 |
2.9 |
38.7 |
36.1 |
6.8 |
10.7 |
8.8 |
6.7 |
2.7 |
15.6 |
22.5 |
|||||||||
| Apr20 |
5327 1045 832 |
835 |
37 |
||||||||||||||||||||||||
| Avg. Red (22) | |||||||||||||||||||||||||||
| May20 |
6046 1320 769 |
769 |
164 |
||||||||||||||||||||||||
| Avg. Red (22) |
|||||||||||||||||||||||||||
| Jun20 |
1026 |
105 |
|||||||||||||||||||||||||
| Avg. Red (22) | |||||||||||||||||||||||||||
| Jul20 |
1160 |
219 |
|||||||||||||||||||||||||
| Avg. Red (22) | |||||||||||||||||||||||||||
| Aug20 |
1058 |
534 |
|||||||||||||||||||||||||
| Avg. Red (22) | |||||||||||||||||||||||||||
| Sep20 |
1500 |
439 |
|||||||||||||||||||||||||
| Avg. Red (22) | |||||||||||||||||||||||||||
| Oct20 |
1389 |
299 |
|||||||||||||||||||||||||
| Avg. Red (22) | |||||||||||||||||||||||||||
| Nov20 |
1075 |
277 |
|||||||||||||||||||||||||
| Avg. Red (22) |
|||||||||||||||||||||||||||
| Dec20 |
986 |
323 |
|||||||||||||||||||||||||
| Avg. Red (22) | |||||||||||||||||||||||||||
| 2020 (1) |
13987 |
4225 |
|||||||||||||||||||||||||
| Avg. Red (22) (23) |
|||||||||||||||||||||||||||
| Right Turn Tickets, Est. (18) | |||||||||||||||||||||||||||
| Jan21 |
701 |
447 |
|||||||||||||||||||||||||
| Avg. Red (22) | |||||||||||||||||||||||||||
| Feb21 |
766 |
605 |
|||||||||||||||||||||||||
| Avg. Red (22) | |||||||||||||||||||||||||||
| Mar21 |
|||||||||||||||||||||||||||
| Avg. Red (22) | |||||||||||||||||||||||||||
| Apr21 |
|||||||||||||||||||||||||||
| Avg. Red (22) | |||||||||||||||||||||||||||
| May21 |
|||||||||||||||||||||||||||
| Avg. Red (22) |
|||||||||||||||||||||||||||
| Jun21 |
|||||||||||||||||||||||||||
| Avg. Red (22) | |||||||||||||||||||||||||||
| Xerox/ Conduent Cam # (9) |
6031 |
6084 |
6083 |
6074 |
6063 |
6024 |
6023 |
6044 |
6043 |
6053 |
6054 |
6001 |
6002 |
6011 |
6012 |
6093 |
6094 |
A |
B |
C |
D |
E |
F |
||||
| System Locations (10) |
Bev- erly Nbd @ Wil- shire |
Olym- pic Wbd @ Do- heny |
Olym- pic Ebd @ Do- heny |
Olym- pic Wbd @ Rox- bury |
Olym- pic Ebd @ Spal- ding |
Sun- set Wbd @ Hill- crest |
Sun- set Ebd @ Hill- crest |
Wil- shire Wbd @ Whit- tier (13) |
Wil- shire Ebd @ Whit- tier (13) |
Santa Mon -ica Ebd @ Cres -cent (14) |
Santa Mon -ica Wbd @ Cres -cent (14) |
Bene -dict Cyn. Nbd @ Sun -set (14) |
Bene -dict Cyn. Sbd @ Sun -set (14) |
Cres -cent Dr. Nbd @ Sun -set (14) (16) |
Cres -cent/ Cold- water/ Bev- erly Sbd @ Sun -set (14) (16) |
Olym- pic Ebd @ Bev- erly (15) (19) (20) |
Olym- pic Wbd @ Bev- erly (15) (19) |
Events, Possible Violations, Total Cites Mailed (not incl. warnings) per Reports Linked Below (2) (7) |
Total Cites Mailed (not incl. cam 6093) |
Total Camera Cites as Reported to the City's Traffic and Parking Comm. (5) |
Total Signed Traffic Cites (non- camera) as Reported to the City's Traffic and Parking Comm. (5) |
Total Citations Issued/ Rolling Right Citations Per CVC 21455.5(i) Annual Reports or Estimates (18) |
Revenue from Court (thou- sands) (17) |
||||
Source docs:
Official Report, July 2004
Official Reports 2008 & 2009 Annual Totals
Official Reports 2008 - 2011
Official Reports 2010 - 2011
Official Reports Nov. - Dec. 2011
Official Reports Jan.- Feb. 2012
Official Reports Feb. 2012 - Sept. 2012
Official Reports Oct. 2012 - Nov. 2012
Official Reports Oct. 2012 - Dec. 2012
Official Reports Nov. 2012
Official Reports, Apr. 2008 - May 2013
Official Reports, Feb. 2008 - June 2013
Official Reports, Aug. 2008 -Aug. 2013
Official Reports, Sept. 2013 - Jan. 2014
Official Reports, Feb. 2014 - June 2014
Official Reports to End of RedFlex Program, July - Oct. 2014
(New ACS/Xerox/Conduent System Started in June 2015)
Official Reports, May - June 2015
Official Reports, Aug. - Nov. 2015
Official Report (expanded), June 2015
Official Reports, July 2015 - Apr. 2016 (18 MB)
Official Reports, May - June 2016
Official Reports, Jul. - Oct. 2016
Official Year-End Report 2016
Official Reports, Nov. 2016 - Mar. 2017
Official Reports, Apr. 2017 - July 2017
Official Reports, Aug. - Sept. 2017
Official Reports, Oct. 2017 - Apr. 2018
Official Year-End Report 2017
Official Reports, May - June 2018
Official Report, July 2018
Official Report, Dec. 2018
Official Year-End Report 2018
Official Report, Jan. 2019
Official Report, Feb. 2019
Official Report, Mar. 2019
Official Report, May 2019
Official Report, June 2019
Official Report, July 2019
Official Report, Oct. 2019
Official Report, Dec. 2019
Official Year-End Report 2019 (23)
Official Reports, Jan. - Feb. 2020
Official Report, Mar. 2020
( ) indicates a footnote.
(1) Annual total, provided by City.
(2) These annual totals or projections are by highwayrobbery.net. Projections are based upon the data shown in the table above. As of 1-25-20 the 2019 column F projection was based upon ten months of data. The 2019 camera-by-camera and citywide totals are not projections.
(3) Un-used columns are to allow for later expansion of City's system.
(4) Monthly average for the year indicated.
(5) From the Monthly Traffic Reports filed with the City's Traffic and Parking Commission, available at the City's website. The figures appear to include warning tickets.
Traffic Reports to T&P Commission, 2015 - 2020
(6) Monthly camera-by-camera data was requested on (date).
In each Xerox camera's early months, TS=test shots, W=warning letters issued.
For the camera systems before 2015, any figures in red type (or, if you are looking at this table in black and white, the upper figure
when there are two or more figures in a cell) are what RedFlex called Total Violations, or all incidents
recorded by the cameras, and due to time limitations may have been posted here only for selected
intersections or months. If there is sufficient public interest, the remaining intersections and/or months will be posted. The
figures in black type are what ACS (the city's camera supplier until 2007) calls Citations Issued and
RedFlex (the supplier between 2008 and 2014) calls Notices Printed, and represent the sum of genuine
citations issued (those filed with the court) plus any Nominations mailed (not filed with
the court, a.k.a. Snitch Tickets).
of enforcement (north, south, east, west, thru, left, right) shown here may be incorrect..
(9) One of these camera codes (Cam #) will appear in the data bar above or near the
photos on your ticket.
(10) The direction of enforcement shown for the Xerox cameras (north, south, east, west) shown here is believed to be correct.
(11) Full intersection-by-intersection data for this month has not yet been posted in the table, but is available
at one of the links just below the table.
(12) Data for this month has not yet been requested.
(13) Listen to the YouTube video about Wilshire/Whittier, in Set # 4, below.
(14) New cameras started June 2015 - See Set # 3, below.
(15) New cameras started in May 2016 - See Set # 7, below.
(16) Coldwater Canyon connects to Beverly Drive, then to this intersection.
(17) For more info about monthly revenue, see Set # 5, below.
(18) In most other cities on this website, the pairs of figures in this column are the citywide total of citations, and the citywide total of rolling
right (or left turn) citations, as retrieved from the annual reports required, beginning with 2013, by CVC 21455.5(i). Most
cities make their annual reports available by the Fall of the following calendar year, but as of Aug. 2019 the City of Beverly Hills had not
produced 2015, 2016, 2017 or 2018 reports giving a breakout of tickets by movement (left, right, straight), so the right turn figures given for those
years in the table above have been estimated, as follows.
The 2015 and 2016 figures were estimated by using the proportions found in the City's report for 2014.
Beginning with 2017, the City's monthly and year-end reports included, for each camera as well as citywide, an average
late time. Highwayrobbery.net used those late times, and a formula, to estimate the number of
right turn tickets generated by each camera, and citywide, in 2017 and 2018. The formula used was Y x ((L - 0.5)/Z) where Y is the number of
tickets (of all movements) issued as reported by the City, L is average late time for the particular camera, as reported by the City, and Z is our
estimate of the average late time for a right turn ticket during the year (37 sec. in 2017 and 24 sec. in 2018, the second highest late time
reported by the City). The number shown in blue is the arithmetic total of the figures shown for the individual cameras. Also see Set # 6, below.
(19) If you have a ticket from this camera, see Set # 7, below, and please email us.
(20) Per the official reports (linked above) cameras 6093 and 6094 operated for only eight days in April 2018 and nine days in May 2018.
(21) Monthly camera-by-camera data was requested on 5-2-19, 6-8-19 and 7-25-19 and was received on 8-2-19.
(22) These figures for average time into red, or average Late Time, are from the monthly and annual official reports linked above. No annual figures
have been made available for 2015, 2016 or 2019. The citywide annual figure posted above for 2019 is highwayrobbery.net's unweighted average
of the monthly citywide figures. Also see Set # 2, below.
(23) The official year-end report for 2019 (which gives the average time into red for each camera) was requested
on 1-25-20 and again on 3-18-20.
No Oversight: No More "Late Time" Reports
During the time RedFlex operated the City's cameras, the City provided bar graphs of Late Times (Time into Red), for each of its cameras.
The RedFlex graphs - entitled RedFlex Redlight Offender Statistics (RROS) - tracked violations recorded, not tickets issued.
(A large number of long Late Time violations in a curb lane is believed to indicate heavy ticketing on right turns. The curb lane will be the lane with the highest lane number.)
The picture above is a RROS example from another city.
July 2008
Jan. 2009
July 2009
Jan. 2010
July 2011
Oct. 2011
Feb. 2012
July 2012
Aug. 2012
July 2013
June 2014
Bar graphs, or the equivalent, are available for more than fifty other cities - see the list in the expanded version of Defect # 9.
In May 2016 we began trying to obtain Late Time reports for the cameras Xerox/Conduent operates for the City. Here is the request we made on Nov. 8, 2017:
"Reports
discussing, tabulating or
listing Late Times (or, Time
into Red, or number of seconds
of red traffic signal, or the
egregiousness) of the Possible
Violations and/or Violations
Mailed in each and/or any of
the months, or any other time
period, May 2016 to the
present." "The City's contract with Xerox [now Conduent] says (at 3(o) of Exhibit B): 'Vendor shall maintain a database... with the following information... ii. Number of seconds of red traffic signal.'""If the City still has no responsive reports, please instead provide a digital copy of the red light camera ticket database, excluding photos or personal information about the driver but not excluding the zip code that the ticket was sent to and not excluding the age or birth year of the person cited." |
In an email dated Nov. 22, 2017 the BHPD replied,
"These reports will be provided at a later date."
There were multiple put offs until Oct. 2018 when we received the monthly report for July 2018, which was in a new format and included an average late time and an average speed, for each camera.
Although some of those figures have been added to the big Set # 1 table above, we have the following concerns about them.
1. They may not be reliable.
a. Many of the late time figures vary widely, month-to-month. Example: For the camera at eastbound Olympic/Beverly, the figures for the first three months
of 2019 were reported to be 2.3, 27.0, and 2.0.
b. The average speed figures do not vary much, month-to-month. Looking at the first seven months of 2019, for ten of the cameras the seven monthly average speeds vary by four mph or less (including three cameras where it varies by only one mph), and of those ten cameras, six have very similar average speeds, all fitting within the range of of 17 - 22 mph.
2. Even if they were found to be completely reliable, Conduent's late time figures will be of very limited use to City safety engineers (and the public) as Conduent does not break the figures down by lane or time of day, like the software of the City's former vendor RedFlex does.
Also see Set # 6 below, and footnote 18 to the big Set # 1 table, above.
The Contract
The 2007 Contract
In Sept. 2012 the City extended the 2007 contract to Oct. 2013. The City did not negotiate a lower price, so paid approx. $277,000 too much for the year. See FAQ # 17. The report submitted for the extension revealed that they made a net profit of nearly $1 million during the previous year.
Invoices received in July 2013 showed (and again in July 2014) show that the City continued to pay $5870 per camera, per month.
In Aug. 2013 the city manager extended the contract to Oct. 14, 2014.
The 2014 Contract - Expanding, and Then Expanding More
At their Oct. 7, 2014 meeting the City Council approved 4 - 1 a staff recommendation to extend the program for five more years, to replace RedFlex with Xerox/ACS, and to add six more cameras. (Safer Streets LA did a study of the proposed new cameras, and found them to be unwarranted.)
The selection of Xerox/ACS over RedFlex supposedly was due to Xerox' bid ($638,880 per year) being lower than RedFlex' ($792,000).
The new contract says that the City will pay Xerox $3694 per month for each of the cameras the company will install at the locations formerly covered by RedFlex cameras.
Strangely, the City put the contract out to bid without first making an attempt to negotiate with RedFlex. Had they negotiated with RedFlex they should have been able to obtain the same pricing as that negotiated by another RedFlex client, Elk Grove, California, whose March 2014 contract for its five camera system includes this pricing table.
A complete copy of the Elk Grove contract is available on the Elk Grove Docs page.
Did RedFlex accidentally run over the Beverly Hills city hall mascot, or something?
When I applied the Elk Grove pricing and terms to Beverly Hills, I got this:
Just looking at the rent over five years, without the adjustments highwayrobbery.net suggests for loyalty, etc. and the cost of the transition, RedFlex would have been cheaper by $370,080. And with Xerox the City has taken on a large cancellation fee while the typical RedFlex renewal contract - like Elk Grove's - allows cancellation with no fee.
To cover the $370,080 extra rent, Beverly Hills will need to issue an extra 4112 tickets (the City's fine revenue averaged $90 for each ticket it issued, in 2013).
A Jan. 20, 2015 Beverly Hills Courier article said that the Xerox cameras would be in operation by mid-February 2015. A later article said that operation would begin in June - and it did. That additional four-month delay in re-starting the cameras brought highwayrobbery.net's estimate of the revenue lost during the transition to $800,000.
2016: Expanding More
On May 3, 2016 the 30-day warning period began for new cameras at Olympic and Beverly Drive. See Set # 7 below for more about the heavy ticketing by those new cameras.
This list of contracts and amendments may not be up-to-date - there could be a contract or amendment later than the one listed above.
Beverly Hills Docs Set # 4
Info About Wilshire/Whittier
In Oct. 2013 Channel 4 KNBC did a story about Jay Beeber's report on the short yellow at Wilshire and Whittier and its effect on the number of tickets.
On Feb. 3, 2014 Channel 5 KTLA did an interview with Beeber.
Beverly Hills Docs Set # 5
The Revenue
The rightmost column in the Set # 1 table, above, shows the monthly red light camera ticket fine revenue the City has received from the court. The Revenue Spreadsheet on the LA County Docs page shows the revenue received by all red light camera cities in LA County.
Beverly Hills Docs Set # 6
No Oversight: Missing Annual Reports
California Senate Bill 1303 of 2012 requires camera vendors to file an annual report with the Judicial Council for each California city serviced by the vendor. The reports
are supposed to give a breakdown of the quantity of citations issued (into straight, right, and left), and also state the number of traffic collisions that
occurred at each intersection prior to and after the installation of the camera. SB 1303 was codified as CVC 21455.5(i).
In response to highwayrobbery.net's requests for copies of the annual reports covering 2015, 2016, 2017 and 2018 the BHPD sent documents which did not include the required
breakout by movement or the collision history. Our repeated requests for reports compliant with CVC 21455.5(i) have been met with multiple put offs. As a result,
the right turn figures given for those four years in the Set # 1 table above are our estimates. See the table's footnote 18 for more details.
On Feb. 14, 2019 highwayrobbery.net sent the city council a copy of the following email originally sent to the BHPD in Nov. 2017:
The City's contract with Conduent says (at 3(n) of Exhibit B), "Vendor shall all provide an annual report to the Judicial Council pursuant to
CVC requirements." Has the vendor given you an ETA for the annual reports for 2015 and 2016? Here I should note that while
fellow (until 2019) Xerox/Conduent customer San Francisco has reported, "Our vendor, Xerox [now Conduent], does not track whether a violation involved traveling
straight through the intersection, turning right, or turning left," (the breakout by movement described in CVC 21455.5(i)), in
Beverly Hills the contract (at 3(o) of Exhibit B) requires Xerox to do that tracking: "Vendor shall maintain a database... with the
following information... iii. Type of violation (such as right turn, left turn, or straight through)."
Beverly Hills Docs Set # 7
No Oversight: Heavy Ticketing at Olympic/Beverly in 2017, 2018, 2019 and 2020
On 8-2-18 we wrote to the BHPD:
| For Lt. Moreno: I periodically request the City's camera-by-camera ticketing totals and publish them on my website highwayrobbery (dot) net. The most recent figures I have - which were requested on April 9 and received on June 18 - show that in the first four months of 2018 the Ebd Olympic/Beverwil/Beverly camera produced about 36% of all the camera tickets citywide, up from 31% in 2017. Is anything being done to fix that situation? Are you prosecuting those tickets, or dismissing/refunding them? |
On 8-6-18 Lt. Moreno replied (the following is his entire reply):
"Thank you for your e-mail. Our photo red light program is in compliance with all state
and federal laws. All who are issued a photo red light ticket are afforded the
opportunity to dispute them in a court of law. Thank you again for your inquiry."
On 8-7-18 we wrote to the city council:
| For the Beverly Hills City
Council: In the first four months of 2018 the red light camera monitoring eastbound cars at Olympic/Beverwil/Beverly produced about 36% of all the camera tickets citywide, up from 31% in 2017, while the camera monitoring westbound cars at that intersection produced just 3% of all the tickets. If the current rate of ticketing continues through the end of the year, the 2018 total fine for eastbound tickets at that intersection will be $3.3 million. I wrote to the BHPD about this, without success - see the thread [above]. |
Neither the council nor City staff replied to that email, but the next two sets of ticketing reports we received, which covered the months
of May, June and July 2018 (those reports are at links in Set # 1, above) showed that ticketing at the intersection was way down.
Ticketing Back Up in Late 2018 and 2019
On Feb. 14, 2019 we received the ticketing reports for Aug. - Dec. 2018, which showed that ticketing in December 2018 was three times the rate in July - Oct. 2018. Later that day (Feb. 14) we emailed the city council about the jump in ticketing.
Cameras Not Justified
Interestingly, well before the cameras were installed at the intersection, accident data did not seem to justify putting cameras there. A 2015 staff report to the city council said (on page one):
"Based upon review of accident data, the average collision rate is equal to the statewide average for comparable intersections."
Nevertheless, that staff report recommended that the intersection and its signals should be modified, and in May of 2017 the City awarded a contract for that work. Additional documents:
Mar. 2017 Design Specs (part of RFP) (14MB file)
May 2017 Award of Contract
We don't yet know just when the contract work was carried out, but it is possible that it brought the (temporary) reduction in ticketing which became visible in April 2018.
The City Responds, but Denies Refund
On Aug. 3, 2019 the City wrote:
We determined there was room to make modifications to the intersection to reduce the number of citations generated by the photo red light.
Here are the steps which we took:
Additional signs warning of the photo enforced enforcement will be posted on the approach (eastbound). It should be noted that
current signage at the intersection complies with California State Law.
The yellow phase at Beverly Dr. will be adjusted to an even higher time than what is mandated by State Law (3.06 secs)."
We wrote right back asking about refunds, and on Aug. 5 the City wrote:
"Since the tickets were legally issued, we can’t take them back."
We have seen big refunds in other cities, examples being South San Francisco and currently in San Mateo. Why can't Beverly Hills make a refund?
The City has $192 million of unassigned funds, "... available for spending at the City's discretion." (Per page 24 of the City's
annual audit book (the "CAFR"), which came out in December 2018.) It would take only 1% of that Mad Money to refund the City's cut of
the fines so unfairly imposed at eastbound Olympic/Beverly.
Beverly Hills Docs Set # 8
More Coming
There may be some more Beverly Hills information posted soon. Mark your calendar to remind you to come back here and look!
---------------------------------
RED LIGHT CAMERAS
www.highwayrobbery.net
www.highwayrobbery.net