If you haven't already done so, please
read the Del Mar section on the Camera Towns page
Do you live in LA County? Was Zev
Yaroslavsky your County Supervisor? (He
represented the Third District, which includes the
central and western San Fernando Valley, Malibu, Santa
Monica, Venice, Beverly Hills, the City of West
Hollywood, and part of Hollywood.)

Sheila "Kuehl Cams" Kuehl, in 2007
During her career in the California
Legislature, Kuehl made three attempts to pass bills to allow
the use of automated speed enforcement (photo radar) in
California.
In 2016 she voted to put an additional LA County-wide sales tax, to go to Metro, on the Nov. 2016 ballot - and it passed. (See Measure M on the Action/Legis page, for more about that tax.)
Kuehl may be up for re-election in Nov. 2022.
City of
Del Mar Documents
(and Information)
Del Mar, pop. 5000, is on the coast 15 miles
north of downtown San Diego.
It may be possible to completely
ignore a Del Mar ticket !
If your "ticket" does not have the Superior Court's name
and address on it, it is a fake ticket, which I call a
"Snitch Ticket." For more details about Snitch
Tickets, see the Snitch Ticket section at the top of the
Your Ticket page.
Del Mar
Docs Set # 1
Ticket Counts
(Citations
Issued)
New 11-6-10,
updated 5-25-20
| Cam # |
CAHE-01 |
CAVV-01 |
CAVV-03 |
|
|
|
||||||
| Camino Del Mar @ Del Mar Heights nbd straights and lefts |
Camino Del Mar @ Via de la Valle sbd |
Camino Del Mar @ Via de la Valle nbd |
[3] |
Total Citations Issued as % of Events Re- corded |
Total Violations Recorded/ Notices Printed [1] [4] |
Total Citations Issued/ Left Turn Citations Per CVC 21455.5(i) Annual Reports [8] |
Revenue from Court (thou- sands) [9] |
|||||
| May04 |
||||||||||||
| Jun04 |
16 11 |
88 63 |
37 29 |
141 103 |
||||||||
| Jul04 |
225 114 |
516 359 |
69 50 |
810 523 |
||||||||
| Aug04 |
189 100 |
380 279 |
28 20 |
597 399 |
||||||||
| Sep04 |
112 56 |
231 165 |
16 11 |
359 232 |
||||||||
| Oct04 |
||||||||||||
| Nov04 |
||||||||||||
| Dec04 |
||||||||||||
| 2004 |
||||||||||||
| Jan05 |
77 55 |
145 101 |
27 15 |
249 171 |
||||||||
| Jul05 |
153 55 |
316 184 |
34 15 |
503 254 |
||||||||
| 2005 [2] |
4512 2550 (proj.) |
|||||||||||
| Jan06 |
61 29 |
123 81 |
19 8 |
203 118 |
||||||||
| Jul06 |
77 16 |
231 94 |
34 12 |
342 122 |
||||||||
| 2006 [2] |
3270 1440 (proj.) |
|||||||||||
| Jan07 |
53 33 |
74 65 |
16 10 |
143 108 |
||||||||
| Jul07 |
58 18 |
324 189 |
23 18 |
405 225 |
||||||||
| 2007 [2] |
3288 1998 (proj.) |
|||||||||||
| Jan08 |
21 9 |
111 85 |
11 8 |
143 102 |
||||||||
| Jul08 |
23 6 |
122 79 |
7 4 |
152 89 |
||||||||
| 2008 [2] |
1770 1146 (proj.) |
|||||||||||
| Jan09 |
14 7 |
42 32 |
6 3 |
62 42 |
||||||||
| Jul09 |
77 39 |
124 89 |
11 4 |
212 132 |
||||||||
| 2009 [2] |
1644 1044 (proj.) |
|||||||||||
| Jan10 |
57 43 |
61 45 |
12 9 |
130 97 |
||||||||
| Mar10 |
151 105 |
|||||||||||
| Apr10 |
155 106 |
|||||||||||
| Jul10 |
112 48 |
113 59 |
9 5 |
234 112 |
||||||||
| Sep10 |
133 83 |
|||||||||||
| Oct10 |
117 78 |
|||||||||||
| 2010 [2] |
1840 1162 (proj.) |
|||||||||||
| Jan11 |
150 101 |
|||||||||||
| Feb11 |
||||||||||||
| Mar11 |
128 92 |
|||||||||||
| Apr11 |
138 85 |
|||||||||||
| May11 |
||||||||||||
| Jun11 |
||||||||||||
| Jul11 |
176 96 |
|||||||||||
| Aug11 |
||||||||||||
| Sep11 |
131 86 |
|||||||||||
| Oct11 |
125 91 |
|||||||||||
| Nov11 |
||||||||||||
| Dec11 |
||||||||||||
| 2011 [2] |
1696 1102 (proj.) |
|||||||||||
| Jan12 |
154 115 |
|||||||||||
| Feb12 |
93 71 |
|||||||||||
| Mar12 |
111 81 |
|||||||||||
| Apr12 |
107 76 |
|||||||||||
| May12 |
95 70 |
|||||||||||
| Jun12 |
150 111 |
|||||||||||
| Jul12 |
173 126 |
|||||||||||
| Aug12 |
128 86 |
|||||||||||
| Sep12 |
93 64 |
|||||||||||
| Oct12 |
70 55 |
|||||||||||
| Nov12 |
24 14 |
61 48 |
7 4 |
92 66 |
||||||||
| Dec12 |
69 47 |
|||||||||||
| 2012 [2] |
73% |
1335 968 |
||||||||||
| Jan13 |
68 52 |
|||||||||||
| Feb13 |
87 35 |
|||||||||||
| Mar13 |
105 42 |
|||||||||||
| Apr13 |
109 39 |
|||||||||||
| May13 |
74 22 |
|||||||||||
| Jun13 |
44 18 |
|||||||||||
| Jul13 |
165 86 |
|||||||||||
| Aug13 |
130 74 |
|||||||||||
| Sep13 |
62 32 |
|||||||||||
| Oct13 |
85 54 |
|||||||||||
| Nov13 |
99 66 |
|||||||||||
| Dec13 |
95 40 |
|||||||||||
| 2013 [2] |
50% |
1123 560 |
392 141 |
|||||||||
| Jan14 |
100 68 |
4 |
||||||||||
| Feb14 |
73 39 |
|||||||||||
| Mar14 |
156 59 |
|||||||||||
| Apr14 |
28 9 |
108 39 |
3 1 |
139 49 |
||||||||
| May14 |
47 13 |
153 102 |
8 2 |
208 117 |
||||||||
| Jun14 |
21 8 |
134 77 |
4 2 |
159 87 |
||||||||
| Jul14 |
120 55 |
192 125 |
7 6 |
319 186 |
6 |
|||||||
| Aug14 |
106 62 |
173 137 |
4 2 |
283 201 |
||||||||
| Sep14 |
190 144 |
|||||||||||
| Oct14 |
212 171 |
|||||||||||
| Nov14 |
249 166 |
|||||||||||
| Dec14 |
77 33 |
111 69 |
5 2 |
193 104 |
||||||||
| 2014 [1] |
61% |
2281 1391 |
845 591 |
|||||||||
| Jan15 |
219 151 |
12 |
||||||||||
| Feb15 |
255 166 |
|||||||||||
| Mar15 |
140 83 |
156 98 |
4 2 |
300 183 |
||||||||
| Apr15 |
259 181 |
|||||||||||
| May15 |
68 27 |
161 97 |
5 1 |
234 125 |
||||||||
| Jun15 |
144 80 |
187 100 |
6 2 |
337 182 |
||||||||
| Jul15 |
139 51 |
231 108 |
11 1 |
381 160 |
16 |
|||||||
| Aug15 |
90 15 |
189 41 |
2 0 |
281 56 |
||||||||
| Sep15 |
74 25 |
145 51 |
6 2 |
225 78 |
||||||||
| Oct15 |
87 26 |
143 66 |
5 0 |
235 92 |
||||||||
| Nov15 |
101 34 |
122 50 |
9 1 |
232 85 |
||||||||
| Dec15 |
105 50 |
137 71 |
7 5 |
249 126 |
||||||||
| 2015 [2] |
49% |
3207 1585 |
987 590 |
|||||||||
| Jan16 |
201 92 |
9 |
||||||||||
| Feb16 |
109 75 |
165 126 |
2 1 |
276 202 |
||||||||
| Mar16 |
294 189 |
|||||||||||
| Apr16 |
215 137 |
|||||||||||
| May16 |
261 156 |
|||||||||||
| Jun16 |
177 13 |
192 37 |
0 0 |
369 50 |
||||||||
| Jul16 |
384 0 |
8 |
||||||||||
| Aug16 |
341 156 |
|||||||||||
| Sep16 |
295 193 |
|||||||||||
| Oct16 |
187 121 |
|||||||||||
| Nov16 |
245 160 |
|||||||||||
| Dec16 |
211 134 |
|||||||||||
| 2016 [2] |
49% |
3279 1590 |
1258 641 |
|||||||||
| Jan17 |
198 130 |
14 |
||||||||||
| Feb17 |
260 146 |
|||||||||||
| Mar17 |
192 121 |
246 174 |
0 0 |
438 295 |
||||||||
| Apr17 |
324 184 |
12 |
||||||||||
| May17 |
100 52 |
152 97 |
0 0 |
260 151 |
||||||||
| Jun17 [10] |
406 232 |
|||||||||||
| Jul17 |
230 121 |
200 130 |
6 4 |
436 255 |
17 |
|||||||
| Aug17 |
147 83 |
193 115 |
4 1 |
344 199 |
||||||||
| Sep17 |
260 150 |
|||||||||||
| Oct17 |
271 169 |
11 |
||||||||||
| Nov17 |
299 195 |
|||||||||||
| Dec17 |
255 159 |
7 |
||||||||||
| 2017 [1] |
1764 973 |
1940 1267 |
47 25 |
60% |
3751 2265 |
1904 894 |
||||||
| Jan18 |
109 67 |
151 104 |
6 5 |
266 176 |
11 |
|||||||
| Feb18 |
107 80 |
129 81 |
7 5 |
243 166 |
||||||||
| Mar18 |
138 88 |
147 95 |
4 1 |
289 184 |
||||||||
| Apr18 |
104 59 |
146 85 |
10 4 |
260 148 |
10 |
|||||||
| May18 |
92 60 |
186 118 |
11 5 |
289 183 |
||||||||
| Jun18 |
0 0 |
183 121 |
10 4 |
193 125 |
||||||||
| Jul18 |
0 0 |
222 153 |
11 8 |
233 161 |
7 |
|||||||
| Aug18 |
0 0 |
238 156 |
7 2 |
245 158 |
10 |
|||||||
| Sep18 |
234 55 |
160 114 |
4 1 |
398 170 |
||||||||
| Oct18 |
114 66 |
125 91 |
2 1 |
241 158 |
||||||||
| Nov18 |
91 57 |
130 79 |
7 6 |
228 142 |
||||||||
| Dec18 |
76 44 |
163 110 |
5 3 |
244 157 |
||||||||
| 2018 [1] |
1065 576 |
1980 1307 |
84 45 |
62% |
3129 1928 |
1427 745 |
||||||
| Jan19 |
85 53 |
156 115 |
7 5 |
248 173 |
||||||||
| Feb19 |
61 39 |
139 106 |
4 3 |
204 148 |
||||||||
| Mar19 |
112 79 |
189 146 |
5 4 |
306 229 |
||||||||
| Apr19 |
73 41 |
175 117 |
9 8 |
257 166 |
||||||||
| May19 |
69 39 |
153 96 |
8 5 |
230 140 |
||||||||
| Jun19 |
94 51 |
174 115 |
9 3 |
277 169 |
||||||||
| Jul19 |
98 49 |
177 110 |
9 6 |
284 165 |
||||||||
| Aug19 |
86 52 |
220 156 |
3 0 |
309 208 |
||||||||
| Sep19 |
82 45 |
152 101 |
5 3 |
239 149 |
||||||||
| Oct19 |
99 60 |
168 111 |
6 0 |
273 171 |
||||||||
| Nov19 |
84 52 |
149 97 |
4 2 |
237 151 |
||||||||
| Dec19 |
97 68 |
131 80 |
6 6 |
234 154 |
||||||||
| 2019 [2] |
1040 628 |
1983 1350 |
75 45 |
65% |
3098 2023 |
|||||||
| Jan20 [5] |
||||||||||||
| Feb20 [5] | ||||||||||||
| Mar20 [5] | ||||||||||||
| Apr20 [5] | ||||||||||||
| May20 [5] | ||||||||||||
| Jun20 |
||||||||||||
| 2020 |
||||||||||||
| Cam # |
CAHE-01 |
CAVV-01 |
CAVV-03 |
|
|
|
||||||
| Camino Del Mar @ Del Mar Heights nbd straights and lefts |
Camino Del Mar @ Via de la Valle sbd |
Camino Del Mar @ Via de la Valle nbd |
[3] |
Total Citations Issued as % of Events Re- corded |
Total Violations Recorded/ Notices Printed [1] [4] |
Total Citations Issued/ Left Turn Citations Per CVC 21455.5(i) Annual Reports [8] |
Revenue from Court (thou- sands) [9] |
This table made by highwayrobbery.net, using official reports provided by the City under the California Public Records Act.
Official
reports,
2004 - 2010
Official
reports, 2010 - 2012
Official
reports, 2012 - 2013
Official
reports, 2013 - 2014
Official
reports, 2014 Apr. - July
Official
report, Aug. 2014
Official
reports, 2010 - 2015
Official
reports, Spring 2015
Official
reports, Late 2015
Official
reports, Early 2016
Official
reports, 2016 - 2017
Official
reports, 2017 - 2018
Official
reports, 2018 - 2019
Official
reports, Late 2019
[ ] indicates a
footnote.
[1] Totals are as provided by the City.
[2] These annual totals, or annual
projections, are by highwayrobbery.net.
[3] Un-used columns are to allow for later
expansion of City's system.
[4] Any figures in red type (or, if you are
looking at this table in black and white, the upper figure
when there are two or more figures in a cell) are what
RedFlex calls Total Violations, or all incidents recorded
by the cameras, and due to time limitations may have been
posted here only for selected months or locations.
If there is sufficient public interest, the remaining
months will be posted. The figures in black
type are what RedFlex calls Notices Printed, and represent
the sum of genuine citations issued (those filed with the
court) plus any Nominations mailed (not filed with
the court, a.k.a. Snitch Tickets).
[5] Monthly data was requested on:
5-26-20.
[6] The camera enforcement is believed to be
on traffic on the first-named street, but the direction
of enforcement (north, south, east, west, thru, left,
right) is not yet available.
[7] Includes enforcement of posted "no turn
on red" signs.
[8] From the annual
reports required, beginning with 2013, by CVC
21455.5(i). They become available by the Fall of the
following year. Also see Set # 4, below.
[9] From reports
received from the Court and the City. For
more info about program finances, see Set # 3,
below.
[10] No report is on hand for June
2017. The June 2017 figures shown above
are the difference between the official annual
total and the totals of the other 11 months.
Del Mar Docs Set # 2
"Late Time"
Graphs
The City provided bar graphs of Late
Times, etcetera, for all of its cameras.
These graphs track violations recorded, not tickets
issued.
Where there is a large number of long Late Time
violations in a curb lane, it is believed to indicate
heavy ticketing on right turns.
(The curb lane will be the lane with the highest lane
number.)
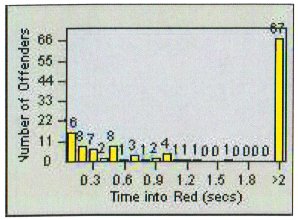
The picture above is an example from another
city.
CAHE-01,
July
2005
CAHE-01,
July 2010
CAVV-01,
July 2005
CAVV-01,
July 2010
CAVV-03,
July 2005
CAVV-03,
July 2010
Bar graphs are available for more than
fifty other cities - see the list in the expanded
version of Defect # 9.
Del Mar Docs Set # 3
The Contract
Agenda
and Minutes of 2003 Public Hearing
2003
Contract
2009
Amendment
The 2009 Amendment extended the
contract to June 2016. The City can cancel before
then, but it must give notice one year ahead of
time.
Invoices
received in June 2013 showed that the City is paying
$1578 per camera.
U-T Editorial
On Oct. 10, 2013, several days before the hearing
scheduled for the city council in Poway to consider
their staff's recommendation
to remove the cameras from that City, the Union-Tribune
published an editorial
which recommended:
"Let’s eliminate every trace of this bad civic
memory.
And to city leaders in Oceanside, Vista, Encinitas,
Solana Beach and Del Mar — it’s time to do likewise.
The cameras are simply not doing the intended job."
Sept. 15 2014: Discussion about Quitting
A June 2014 article
said the City was considering closing the program.
Additional
Article
Staff
Report for Sept. 15 Meeting
At the meeting the council was skeptical about the
claimed safety gains but nevertheless voted to continue
the program. During the meeting staff showed a
slide indicating that 92% of the tickets have been going
to visitors.

May 2016: More Discussion about
Quitting
The contract was set to
expire the next month and the staff recommendation
was to renew for another year, but at their May 16,
2016 meeting the council put off making a decision
until the Finance Committee (two members of the
council) could conduct a review of the program.
Article
In June 2016 the City
signed a contract
amendment, to allow the program to continue
month-to-month pending the Finance Committee review.
In May 2017 the City sent
RedFlex a letter allowing the program to continue
month-to-month until June 21, 2018.
In June 2019 the City sent
RedFlex a letter
allowing the program to continue month-to-month
until June 2020.
Sept. 2019: New Three to
Five-Year Contract
On Sept. 30, 2019 staff
recommended and the council agreed
(unanimously, without discussion) to a new
contract for 3 years plus two 1-year
extensions, which will occur automatically unless
the City objects. The contract is cancellable
without penalty after 30-days notice.
The monthly rent per camera is $1577 plus an annual
cost-of-living adjustment.
This listing of
contracts and amendments was up-to-date as of
Jan. 2020.
An official report showed that in 2014, 70% of the City's tickets were for left turns.
Del Mar Docs Set # 5
Info on
City's/Sheriff's Website?
As of Nov 5, 2010 I could not find any red light camera program info on either the City's or the sheriff's website.
More Coming
There may be some more Del Mar information posted in the next few weeks. Mark your calendar to remind you to come back here and look!
---------------------------------
RED LIGHT CAMERAS
www.highwayrobbery.net
www.highwayrobbery.net