If
you haven't already done so, please read the San
Rafael section on the Camera Towns page
San
Rafael Documents (Program Closed)
Some of San Rafael's tickets can
possibly be ignored. If your "ticket" does not
have the Superior Court's name and address on it, it is
what I call a "Snitch Ticket." For more details,
see the Snitch Ticket section on the Your Ticket page.
San
Rafael Docs Set # 1
Ticket
Counts
Total
Violations, Notices Printed [4]
| Cam # |
SRA 3IR-01 |
SRA IR3-01 |
|
|
|
|||||
| Third & Irwin [6] |
Irwin and Third [6] |
[3] |
Total Citations Issued as % of Events Re- corded |
Total Violations Recorded/ Notices Printed [1] [4] |
||||||
| Aug09 |
||||||||||
| Sep09 |
0 0 |
25 20 |
25 20 |
|||||||
| Oct09 |
185 154 |
703 506 |
888 660 |
|||||||
| Nov09 |
322 240 |
430 276 |
752 516 |
|||||||
| Dec09 |
216 166 |
248 417 |
632 414 |
|||||||
| 2009 [2] |
1610 |
|||||||||
| Jan10 |
178 151 |
354 287 |
532 438 |
|||||||
| Feb10 |
193 126 |
337 187 |
530 313 |
|||||||
| Mar10 |
238 194 |
383 296 |
621 490 |
|||||||
| Apr10 |
240 167 |
378 276 |
618 443 |
|||||||
| May10 |
259 170 |
343 216 |
602 386 |
|||||||
| Jun10 |
||||||||||
| Jul10 |
214 120 |
366 242 |
580 362 |
|||||||
| Aug10 |
||||||||||
| Sep10 |
||||||||||
| Oct10 |
245 119 |
303 140 |
548 259 |
|||||||
| Nov10 |
||||||||||
| Dec10 |
||||||||||
| 2010 [2] |
4613 (proj.) |
|||||||||
| Jan11 |
165 86 |
249 170 |
414 256 |
|||||||
| Feb11 |
||||||||||
| Mar11 |
||||||||||
| Apr11 |
225 91 |
286 158 |
511 249 |
|||||||
| 18 Months: Nov09 - Apr11 [8] |
4069 |
6014 |
10083 |
|||||||
| May11 |
||||||||||
| Jun11 |
||||||||||
| Jul11 |
244 116 |
351 221 |
595 337 |
|||||||
| Aug11 |
||||||||||
| Sep11 |
||||||||||
| Oct11 |
243 135 |
298 173 |
541 308 |
|||||||
| Nov11 |
||||||||||
| Dec11 |
||||||||||
| 2011 [2] |
3450 (proj.) |
|||||||||
| Jan12 |
193 102 |
219 84 |
412 186 |
|||||||
| Feb12 |
185 90 |
271 89 |
456 179 |
|||||||
| Mar12 |
200 101 |
261 114 |
461 215 |
|||||||
| Apr12 |
248 104 |
289 109 |
537 213 |
|||||||
| May12 |
177 70 |
238 103 |
415 173 |
|||||||
| Jun12 |
144 79 |
250 124 |
394 203 |
|||||||
| Jul12 |
170 81 |
236 115 |
406 196 |
|||||||
| Aug12 |
186 90 |
244 130 |
430 220 |
|||||||
| Sep12 |
156 81 |
277 122 |
433 203 |
|||||||
| Oct12 |
463 216 |
|||||||||
| Nov12 |
345 186 |
|||||||||
| Dec12 |
267 133 |
|||||||||
| 2012 [2] |
2323 |
|||||||||
| Jan13 |
251 126 |
|||||||||
| Feb13 |
299 170 |
|||||||||
| Mar13 |
346 147 |
|||||||||
| Apr13 |
358 181 |
|||||||||
| May13 |
201 119 |
252 135 |
453 254 |
|||||||
| Jun13 |
174 86 |
218 107 |
392 193 |
|||||||
| Jul13 |
172 78 |
210 113 |
382 191 |
|||||||
| Aug13 |
176 84 |
231 105 |
407 189 |
|||||||
| Sep13 |
199 101 |
248 102 |
447 203 |
|||||||
| Oct13 |
189 88 |
251 99 |
440 187 |
|||||||
| Nov13 |
195 90 |
260 108 |
455 198 |
|||||||
| Dec13 |
145 64 |
265 103 |
410 167 |
|||||||
| 2013 [2] |
2206 |
|||||||||
| Jan14 |
150 56 |
251 99 |
401 155 |
|||||||
| Feb14 |
||||||||||
| Mar14 |
||||||||||
| Apr14 |
CLOSED |
|||||||||
| 2014 [2] |
310 (proj.) |
This table made by highwayrobbery.net, using official reports provided by the City under the California Public Records Act.
Source Docs: Official reports, Sep. 2009 to May 2010
Official statistics, 18 Months, Nov. 2009 to Apr. 2011 [8]
Official reports, 2010 to 2012
Official reports, 2012 to 2013
Official report, Jul. - Sep. 2013
Official reports, late 2013 to Jan. 2014
[ ] indicates a footnote.
[1] Totals are as provided by the City.
[2] Annual total, or annual projection, is by highwayrobbery.net.
[3] Un-used columns are to allow for later expansion of City's system.
[4] Any figures in red type (or, if you are looking at this table in black and white, the upper figure when there are two or more figures in a cell) are what RedFlex calls Total Violations, or all incidents recorded by the cameras, and due to time limitations may have been posted here only for selected months or locations. If there is sufficient public interest, the remaining months will be posted. The figures in black type are what RedFlex calls Notices Printed, and represent the sum of genuine citations issued (those filed with the court) plus any Nominations mailed (not filed with the court, a.k.a. Snitch Tickets).
[5] Monthly data was requested on:
[6] The camera enforcement is believed to be on traffic on the first-named street, but the direction of enforcement (north, south, east, west, thru, left, right) is not yet available.
[7] Includes enforcement of posted "no turn on red" signs.
[8] For this 18-month period, the statistics compiled by the City - see link above - show that during the period there were 2252 right turn violations recorded by the cameras and between 2842 and 5372 left turn violations, making turning violations represent between 51% and 76% of the total. (Please note that these statistics are of violations recorded, not citations issued.)
"Late Time" Graphs
The City provided bar graphs of Late Times, etcetera, for all of its cameras.
These graphs track violations recorded, not tickets issued.
Where there is a large number of long Late Time violations in a curb lane, it is believed to indicate heavy ticketing on right turns.
(The curb lane will be the lane with the highest lane number.)
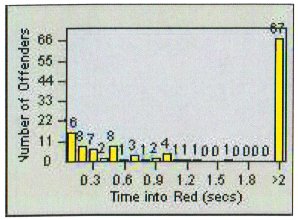
The picture above is an example from another city.
3IR-01 Dec. 2009
3IR-01 Apr. 2010
IR3-01 Dec. 2009 (not yet received)
IR3-01 Apr. 2010
July 2012
Summer 2013
Late 2013
Bar graphs are available for more than fifty other cities - see the list in the expanded version of Defect # 9.
San Rafael Docs Set # 3
Contract,
Grand Jury Report, % of Visitors (Program Closed)
Contract,
Signed
March
2009
Staff Report,
May 2010
Power
Point Presentation, May 2010
2012 Grand
Jury Report
If you would like to read some grand jury reports from
other counties, about their red light cameras, see the
Grand Jury entry in the Site Index.
A staff
report from May 2013 revealed that 78%
of the tickets went to visitors.
Invoices
received in early 2013 and early
2014 showed that the City was paying $5900 per
camera, per month.
The camera program ended when the
contract expired on Mar. 3, 2014.
This listing of contracts and/or
amendments was up-to-date as of Feb. 8, 2014.
San Rafael Docs Set # 4
Encroachment
Permits
Some of the City's cameras are located on CalTrans
right-of-ways, so are operated under an encroachment
permit obtained from CalTrans. HighwayRobbery.net
obtained these documents from CalTrans, via a public
records request.
Permit
Application,
2010
Justification
Correspondence
(Traffic Report), 2010
Some other cities operate cameras under encroachment
permits. For more information about those cities
and about CalTrans' criteria for the issuance of an
encroachment permit, see the CalTrans section on the
Links page.
San Rafael Docs Set # 5
Signal
Timing
In late 2013 we
received information
about the length of the yellows.
San Rafael Docs Set # 6
Prevailing
Wage Action
RedFlex's construction work in San Rafael was the
subject of a Prevailing
Wage action by the California Department of
Industrial Relations.
San Rafael Docs Set # 7
More
Coming
There may be some
more San Rafael information posted in the next few
weeks. Mark your calendar to remind you to
come back here and look!
---------------------------------
RED LIGHT
CAMERAS
www.highwayrobbery.net
www.highwayrobbery.net