Email
Address
Site
Index
by Subject
If
you haven't already done so, please read the
Solana Beach section on the Camera Towns page
City of Solana Beach Documents
(and Information)
Solana Beach, pop. 14,000, is on the
coast 15 miles north of San Diego.
The City signed a contract with RedFlex on Dec. 30,
2003, and began issuing warning tickets in Oct. 2004.
Some of Solana Beach's tickets can be ignored.
If your "ticket" does not have the Superior
Court's name and address on it, it is what I call a
"Snitch Ticket." For more details, see the
Snitch Ticket section on the Your Ticket page, and Set
# 1, below.
Vote No on Sheila Kuehl
Do you live in LA County? Was
Zev Yaroslavsky your County Supervisor? (He
represented the Third District, which includes the
central and western San Fernando Valley, Malibu, Santa
Monica, Venice, Beverly Hills, the City of West
Hollywood, and part of Hollywood.)

Sheila "Kuehl Cams" Kuehl, in 2007
During her career in the California
Legislature, Kuehl made three attempts to pass bills to
allow the use of automated speed enforcement (photo
radar) in California.
Kuehl may be up for re-election in Nov. 2022.
Solana Beach Docs Set # 1
Ticket
Counts
Total
Violations Recorded, Notices Printed, and Citations
Issued [4]
New 11-14-05,
updated 3-5-19
Snitch Tickets
The City's use of Nominations (a.k.a. Snitch
Tickets) probably explains,
(A) the discrepancy between the figures for
Notices Printed and Total Cites Issued (filed with the
court), and
(B) the month-to-month overlap in the serial
numbers (in 2005).
See the table's footnotes for further details.
| Cam # |
101L 01 |
LOSH 01 |
SHLO 01 |
|
|
|
||||||
| Hwy 101 SB @ Lomas Santa Fe |
Lomas Santa Fe EB @ Solana Hills |
Solana Hills NB @ Lomas Santa Fe |
[3] |
Serial Number Range of Citations Issued This Month, per Invoices |
Total Notices Printed as % of Violations Recorded |
Total Violations Recorded/ Notices Printed/ Per Official Monthly CMR Reports and Citations Issued per Invoices [1] [4] [11] |
All Citations Issued Rolling Right Citations per CVC 21455.5(i) Annual Reports: [10] |
Revenue from Court (thou- sands) [12] |
||||
| Oct04 |
||||||||||||
| Nov04 [11] |
74 |
17 |
92 | [7] |
183 |
|||||||
| Dec04 [11] |
138 |
56 |
262 | 00737- 01698 |
456 |
|||||||
| 2004 |
||||||||||||
| Jan05 [11] |
218 129 90 |
129 92 48 |
296 154 129 |
00812- 02005 |
643 375 267 |
|||||||
| Feb05 [11] |
205 125 81 |
77 55 53 |
212 102 96 |
01442- 02332 |
494 282 230 |
|||||||
| Mar05 [11] |
117 |
53 |
79 |
01137- 02616 |
249 |
|||||||
| Apr05 [11] |
91 |
51 |
38 |
01910- 02834 |
180 |
|||||||
| May05 [11] |
85 |
55 |
49 |
02139- 03047 |
189 |
|||||||
| Jun05 [11] |
76 |
53 |
44 |
02494- 03251 |
173 |
|||||||
| Jul05 [11] |
215 52 64 |
121 60 36 |
65 25 20 |
01231- 03408 |
401 137 120 |
|||||||
| Aug05 [11] |
13 |
54 |
21 |
02930- 03509 |
88 |
|||||||
| Sep05 [11] |
12 |
25 |
25 |
03357- 03595 |
62 |
|||||||
| Oct05 |
[5] |
|||||||||||
| Nov05 |
[5] |
|||||||||||
| Dec05 |
[5] |
|||||||||||
| 2005 |
||||||||||||
| Jan06 |
43 18 |
95 67 |
87 53 |
225 138 |
||||||||
| Apr06 |
240 107 |
|||||||||||
| Jul06 |
92 52 |
116 61 |
90 42 |
298 155 |
||||||||
| Oct06 |
252 156 |
|||||||||||
| 2006 [2] |
810 420 (proj.) |
1266 768 (proj.) |
1062 570 (proj.) |
56% |
1668 (proj.) |
|||||||
| Jan07 |
15 10 |
59 52 |
72 46 |
146 108 |
||||||||
| Apr07 |
247 147 |
|||||||||||
| Jul07 |
65 34 |
123 74 |
90 41 |
278 149 |
||||||||
| Oct07 |
231 161 |
|||||||||||
| 2007 [2] |
480 264 (proj.) |
1092 756 (proj.) |
972 522 (proj.) |
61% |
1695 (proj.) |
|||||||
| Jan08 |
40 24 |
72 54 |
63 37 |
175 115 |
||||||||
| Apr08 |
224 149 |
|||||||||||
| Jul08 |
33 11 |
118 62 |
82 37 |
233 110 |
||||||||
| Oct08 |
162 105 |
|||||||||||
| 2008 [2] |
438 210 (proj.) |
1140 696 (proj.) |
870 444 (proj.) |
55% |
1437 (proj.) |
|||||||
| Jan09 |
18 10 |
100 81 |
43 26 |
161 117 |
||||||||
| Apr09 |
173 103 |
|||||||||||
| Jul09 |
37 18 |
115 73 |
61 33 |
213 124 |
||||||||
| Oct09 |
194 133 |
|||||||||||
| 2009 [2] |
330 168 (proj.) |
1290 924 (proj.) |
624 354 (proj.) |
64% |
1431 (proj.) |
|||||||
| Jan10 |
30 22 |
66 54 |
36 24 |
132 100 |
||||||||
| Mar10 |
31 26 |
66 54 |
139 100 |
236 180 |
||||||||
| Apr10 |
35 20 |
82 72 |
184 134 |
301 226 |
||||||||
| Jul10 |
19 16 |
102 79 |
169 119 |
290 214 |
||||||||
| Sep10 |
36 26 |
63 50 |
163 92 |
262 168 |
||||||||
| Oct10 |
24 16 |
71 63 |
146 105 |
241 184 |
||||||||
| 2010 [2] |
350 252 (proj.) |
900 744 (proj.) |
1674 1148 (proj.) |
73% |
2924 2144 (proj.) |
|||||||
| Jan11 |
32 19 |
62 53 |
143 108 |
237 180 |
||||||||
| Feb11 |
||||||||||||
| Mar11 |
28 22 |
65 53 |
143 90 |
236 165 |
||||||||
| Apr11 |
31 21 |
63 47 |
148 95 |
242 163 |
||||||||
| May11 |
||||||||||||
| Jun11 |
||||||||||||
| Jul11 |
36 20 |
94 60 |
156 88 |
286 168 |
||||||||
| Aug11 |
||||||||||||
| Sep11 |
22 11 |
82 67 |
139 99 |
243 177 |
||||||||
| Oct11 |
24 16 |
81 59 |
146 95 |
251 170 |
||||||||
| Nov11 |
||||||||||||
| Dec11 |
||||||||||||
| 2011 [2] |
346 218 (proj.) |
894 678 (proj.) |
1750 1150 (proj.) |
68% |
2990 2046 (proj.) |
|||||||
| Jan12 |
33 17 |
58 48 |
120 76 |
211 141 |
||||||||
| Feb12 |
25 22 |
67 54 |
117 83 |
209 159 |
||||||||
| Mar12 |
17 12 |
77 63 |
128 73 |
222 148 |
||||||||
| Apr12 |
33 21 |
91 75 |
135 93 |
259 189 |
||||||||
| May12 |
26 19 |
102 85 |
149 82 |
277 186 |
||||||||
| Jun12 |
35 28 |
101 91 |
123 92 |
259 211 |
||||||||
| Jul12 |
33 16 |
99 77 |
129 89 |
261 182 |
||||||||
| Aug12 |
0 0 |
100 87 |
168 118 |
268 205 |
||||||||
| Sep12 |
0 0 |
88 71 |
123 72 |
211 143 |
||||||||
| Oct12 |
0 0 |
105 94 |
174 121 |
279 215 |
||||||||
| Nov12 |
0 0 |
67 60 |
121 86 |
188 146 |
||||||||
| Dec12 |
0 0 |
63 54 |
119 82 |
182 136 |
||||||||
| 2012 [2] |
202 135 |
1018 859 |
1606 1067 |
73% |
2826 2061 |
|||||||
| Jan13 |
0 0 |
65 52 |
152 121 |
217 173 |
||||||||
| Feb13 |
0 0 |
63 54 |
131 92 |
194 146 |
||||||||
| Mar13 |
0 0 |
92 76 |
154 102 |
246 178 |
||||||||
| Apr13 |
0 0 |
93 72 |
131 75 |
224 147 |
||||||||
| May13 |
0 0 |
97 71 |
161 108 |
258 179 |
||||||||
| Jun13 |
0 0 |
110 91 |
145 99 |
255 190 |
||||||||
| Jul13 |
0 0 |
117 85 |
101 66 |
218 151 |
||||||||
| Aug13 |
12 7 |
117 92 |
176 117 |
305 216 |
||||||||
| Sep13 |
25 17 |
114 99 |
175 107 |
314 223 |
||||||||
| Oct13 |
28 18 |
115 96 |
198 124 |
341 238 |
||||||||
| Nov13 |
27 18 |
75 63 |
165 98 |
267 179 |
||||||||
| Dec13 |
27 7 |
92 79 |
142 68 |
258 154 |
||||||||
| 2013 [2] |
119 67 |
1150 930 |
1831 1177 |
70% |
3097 2174 |
1715 1124 |
||||||
| Jan14 |
37 14 |
81 63 |
141 50 |
259 127 |
18 |
|||||||
| Feb14 |
27 11 |
83 52 |
123 33 |
233 96 |
||||||||
| Mar14 |
34 6 |
106 76 |
179 59 |
314 141 |
||||||||
| Apr14 |
39 20 |
125 94 |
187 79 |
351 193 |
||||||||
| May14 |
69 45 |
151 115 |
156 110 |
376 270 |
||||||||
| Jun14 |
25 16 |
171 113 |
184 88 |
380 217 |
||||||||
| Jul14 |
33 12 |
147 98 |
157 86 |
337 196 |
18 |
|||||||
| Aug14 |
59 40 |
133 108 |
170 109 |
362 257 |
||||||||
| Sep14 |
83 63 |
119 94 |
198 112 |
400 269 |
||||||||
| Oct14 |
61 47 |
124 99 |
182 109 |
367 255 |
||||||||
| Nov14 |
48 39 |
111 88 |
163 108 |
322 235 |
||||||||
| Dec14 |
46 35 |
109 80 |
157 102 |
312 217 |
||||||||
| 2014 [2] |
561 348 |
1460 1080 |
1997 1045 |
62% |
4013 2473 |
1946 1092 |
||||||
| Jan15 |
54 33 |
106 76 |
143 75 |
303 184 |
21 |
|||||||
| Feb15 |
53 30 |
122 90 |
147 77 |
322 197 |
||||||||
| Mar15 |
76 44 |
172 128 |
188 101 |
436 273 |
||||||||
| Apr15 |
39 27 |
121 101 |
184 103 |
344 231 |
||||||||
| May15 |
47 26 |
154 101 |
144 64 |
345 191 |
||||||||
| Jun15 |
69 32 |
117 84 |
148 61 |
334 177 |
||||||||
| Jul15 |
72 39 |
141 98 |
164 83 |
377 220 |
16 |
|||||||
| Aug15 |
63 38 |
182 140 |
154 82 |
399 260 |
||||||||
| Sep15 |
59 35 |
189 146 |
177 89 |
425 270 |
||||||||
| Oct15 |
60 32 |
185 128 |
175 102 |
420 262 |
||||||||
| Nov15 |
62 30 |
148 102 |
194 107 |
404 239 |
||||||||
| Dec15 |
70 39 |
159 113 |
186 109 |
415 261 |
||||||||
| 2015 [2] |
724 405 |
1796 1307 |
2004 1053 |
61% |
4524 2765 |
2190 1075 |
||||||
| Jan16 |
50 33 |
137 100 |
146 68 |
333 201 |
24 |
|||||||
| Feb16 |
81 34 |
170 123 |
192 119 |
443 276 |
||||||||
| Mar16 |
58 26 |
184 140 |
170 87 |
412 253 |
||||||||
| Apr16 |
72 53 |
181 146 |
197 131 |
450 330 |
||||||||
| May16 |
90 65 |
174 111 |
190 117 |
454 293 |
||||||||
| Jun16 |
66 44 |
204 146 |
186 117 |
456 307 |
||||||||
| Jul16 |
82 53 |
234 175 |
184 127 |
500 355 |
27 |
|||||||
| Aug16 |
498 315 |
|||||||||||
| Sep16 |
435 277 |
|||||||||||
| Oct16 |
461 242 |
|||||||||||
| Nov16 |
489 294 |
|||||||||||
| Dec16 |
433 254 |
|||||||||||
| 2016 [2] |
834 510 (proj.) |
2100 1532 (proj.) |
2162 1278 (proj.) |
65% |
5364 3397 (actual) |
2848 1465 |
||||||
| Jan17 |
343 184 |
25 |
||||||||||
| Feb17 |
422 265 |
|||||||||||
| Mar17 |
494 313 |
|||||||||||
| Apr17 |
449 270 |
27 |
||||||||||
| May17 |
499 261 |
|||||||||||
| Jun17 |
122 42 |
296 143 |
208 92 |
626 277 |
||||||||
| Jul17 |
602 349 |
25 |
||||||||||
| Aug17 |
554 362 |
|||||||||||
| Sep17 |
511 308 |
|||||||||||
| Oct17 |
454 302 |
18 |
||||||||||
| Nov17 |
435 257 |
|||||||||||
| Dec17 |
436 270 |
|||||||||||
| 2017 [1] |
1118 615 |
2620 1635 |
2087 1168 |
59% |
5825 3418 |
2926 1315 |
||||||
| Jan18 |
402 211 |
15 |
||||||||||
| Feb18 |
399 245 |
|||||||||||
| Mar18 |
430 229 |
|||||||||||
| Apr18 |
452 262 |
18 |
||||||||||
| May18 |
445 281 |
|||||||||||
| Jun18 |
58 34 |
246 173 |
178 118 |
482 325 |
||||||||
| Jul18 |
74 49 |
295 174 |
184 105 |
553 328 |
19 |
|||||||
| Aug18 |
81 53 |
303 199 |
199 136 |
583 388 |
22 |
|||||||
| Sep18 |
35 24 |
219 159 |
186 111 |
440 294 |
||||||||
| Oct18 |
41 26 |
231 153 |
177 107 |
449 286 |
||||||||
| Nov18 |
54 37 |
148 102 |
184 121 |
386 260 |
||||||||
| Dec18 |
59 41 |
212 152 |
188 140 |
459 333 |
||||||||
| 2018 [1] |
648 391 |
2747 1785 |
2085 1266 |
5480 3442 |
||||||||
| Jan19 |
52 37 |
191 126 |
188 127 |
431 290 |
||||||||
| Feb19 |
||||||||||||
| Mar19 |
||||||||||||
| Apr19 |
||||||||||||
| May19 |
||||||||||||
| Jun19 |
||||||||||||
| Jul19 |
||||||||||||
| Aug19 |
||||||||||||
| Sep19 |
||||||||||||
| Oct19 |
||||||||||||
| Nov19 |
||||||||||||
| Dec19 |
||||||||||||
| 2019 |
||||||||||||
| Cam # |
101L 01 |
LOSH 01 |
SHLO 01 |
|
|
|
||||||
| Hwy 101 SB @ Lomas Santa Fe [4] |
Lomas Santa Fe EB @ Solana Hills [4] |
Solana Hills NB @ Lomas Santa Fe [4] |
[3] |
Serial Number Range of Citations Issued This Month, per Invoices |
Total Notices Printed as % of Violations Recorded |
Total Violations Recorded/ Notices Printed/ Per Official Monthly CMR Reports and Citations Issued per Invoices [1] [4] [11] |
All Citations Issued Rolling Right Citations per CVC 21455.5(i) Annual Reports: [10] |
Revenue from Court (thou- sands) [12] |
Official reports, 2004 - 2010
Official reports, 2010 - 2012
Official reports, 2010 - 2013
Official reports, 2012
Official reports, 2013 - 2014
Official reports, 2014 - 2015
Official reports, 2006 - 2015
Official reports, 2010, 2011 and late 2015
Official reports, early 2016
Official reports, 2016 - 2017
Official reports, 2017 - 2018
Official reports, 2018 - 2019
[ ] indicates a footnote.
[1] Totals are as provided by the City.
[2] Annual or six month total, or annual or six month projection, is by highwayrobbery.net. The 2016 and 2017 projections are based upon the data shown in the table above.
[3] Un-used columns are to allow for later expansion of City's system.
[4] Figures in red type (or, if you are looking at this table in black and white, the upper figure when there are two or more figures in a cell) are what RedFlex calls Total Violations, or all incidents recorded by the cameras, and due to time limitations may have been posted only for selected months or locations. If there is sufficient public interest, the remaining months will be posted. The figures in black type are what RedFlex calls Notices Printed, and represent the sum of genuine citations issued (those filed with the court) plus Nominations mailed (not filed with the court, a.k.a. Snitch Tickets).
[6] The camera enforcement is on traffic on the first-named street, but the direction of enforcement (north, south, east, west, thru, left) is not yet available.
[7] Data was requested on:
[8] The reports for these months omitted figures for camera 101L. We have asked for new reports.
[9] The report for this month was generated less than ten days after the end of the month, so may not reflect the full number of tickets issued.
[10] From the annual reports required, beginning with 2013, by CVC 21455.5(i). They become available by the Fall of the following year.
[11] Until 2009 the City paid $89 for each cite issued, up to 179 cites per camera per month, and $80 each for additional cites. On Nov. 12, 2005 the city clerk's office supplied copies of RedFlex monthly invoices containing camera-by-camera totals of Citations Issued (filed with the court). Those 2004 & 2005 figures were entered into the table, above, as Total Citations Issued per Invoices and are in blue type (or, if you are looking at this table in black and white, in italic type). Since the 2009 contract amendment the City has paid a flat rate per month regardless of how many tickets are issued.
[12] From reports received from the Court.
An official report showed that in 2014, 56% of the City's tickets were for right turns.
Solana Beach Docs Set # 3
"Late Time"
Graphs
The City provided bar graphs of Late
Times, etcetera, for all of its cameras.
These graphs track violations recorded, not tickets
issued.
Where there is a large number of long Late Time
violations in a curb lane, it is believed to indicate
heavy ticketing on right turns.
(The curb lane will be the lane with the highest lane
number.)
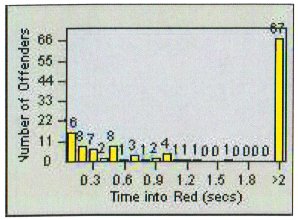
The picture above is an example from another
city.
101L -
July 2005
101L - July
2010
LOSH - July 2005
LOSH- July 2010
SHLO - July 2005
SHLO - July
2010
Bar graphs are available for more than
fifty other cities - see the list in the expanded
version of Defect # 9.
Solana Beach Docs Set # 4
The Contract
(Renewed in 2017)
2003
Contract
2009
Amendment
The 2009 amendment appears to be flat rate
except that it contains, in Exhibit B, this "deficit"
clause:
Except where a balance remains unpaid due to a deficit
in the gross cash received as described herein, the
City agrees to pay the provider within thirty (30)
days after the invoice is received.
The 2009 amendment, for a five-year
extension ending in Oct. 2014 (plus three optional
one-year extensions), allows the City to terminate the
program with 30 days notice.
Per City documents
received in June 2013, the City was paying $2364 per
camera, per month.
U-T Editorial
On Oct. 10, 2013, several days before the hearing
scheduled for the city council in Poway to consider
their staff's recommendation
to remove the cameras from that City, the Union-Tribune
published an editorial
which recommended:
"Let’s eliminate every trace of this bad civic
memory.
And to city leaders in Oceanside, Vista, Encinitas,
Solana Beach and Del Mar — it’s time to do likewise.
The cameras are simply not doing the intended job."
In early 2015 we heard that staff was negotiating a new contract with RedFlex and the parties were very close to agreement, so we wrote to them about the following concerns.
| The program should be evaluated, for
effectiveness, before a contract is negotiated or signed. Among other things, an explanation is needed as to why ticketing has not decreased after years of enforcement but is in fact rising, with 2014 and early 2015 ticketing much higher than in previous years. (Any evaluation should be done by a person having professional credentials in statistics and who is completely independent of the City and the sheriff; and after such an evaluation is published, and before any hearing is held before the Council, there should be a review period of a couple weeks to provide time for the public to comment on the evaluation.) Also, there is the question of the rent. For the last five years [2009 - 2014] the City has paid $2364 to $2386 per camera per month, and the proposed new contract may continue at that same amount, despite the fact that the City has had its RedFlex cameras for a long time, since 2004. Here is how RedFlex has agreed to reward another City's loyalty. 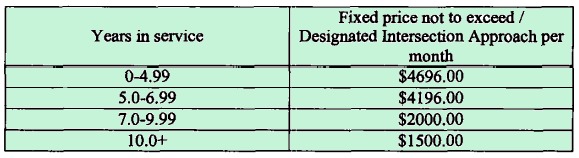 Table from the Mar. 2014 contract between the City of Elk Grove, California and RedFlex, for that City's system of five cameras. If Solana Beach agrees to another five year extension and continues to pay the old price, the City will pay an extra $155,520 over the five years (compared to Elk Grove's prices), and to cover that extra rent the City will need to issue an extra 1556 tickets (assuming that the City receives $100 of revenue from each ticket issued). From March 3, 2015 email to Solana Beach City Council |
Instead of negotiating a new contract in
2015, the City took the second and third of the optional
one-year extensions, resulting in a new expiration date
of Oct. 2017.
Extension on Sept. 12, 2017 Council Agenda
The staff report recommended an up-to-eight year extension of the program, at the same price ($2386) as before and the council approved it 5 - 0 with no discussion except that Councilmember Zito (seconded by another councilmember) asked that, at a later date, there be an item to consider the efficacy of the cameras. The contract contains an escape clause (section 7.2 of the 2009 contract) so the City will continue to have the ability to shut off the cameras on 30 days notice, with no penalty.
Over the potential eight years ending in 2025 (a five-year initial term and three optional one-year extensions) the City will pay $255,168 too much, compared to Elk Grove's prices. It should also be noted that the nearby City of Del Mar, which has three cameras, pays RedFlex $1578 per month per camera.
RedFlex Proposal to Solana Beach
Our Opposition Letter
Staff Report Update, Sept. 12
Our Opposition to Staff Report Update
Support by RedFlex, Sept. 12
Opposition by SaferStreets LA
Signed Contract
Post-meeting Article
This list of contracts and amendments was up-to-date as
of Sept. 12, 2017.
Solana Beach Docs Set # 5
Info on City's
Website?
I have not been able to find a red
light camera program info page on either the City's or
the sheriff's website.
More Coming
There may be some more information posted in the next few weeks. Mark your calendar to remind you to come back here and look!
RED LIGHT CAMERAS
www.highwayrobbery.net
www.highwayrobbery.net