If
you haven't already done so, please read the
Garden Grove section on the Camera Towns page
City of
Garden Grove Documents
(and Information)
Garden Grove, pop. 171,000, is 20 miles
southeast of Los Angeles.
Some of Garden Grove's
tickets can be ignored. If your "ticket" does
not have the Superior Court's name and address on
it, it is what I call a "Snitch Ticket." For
more details, see the Fake Ticket section on the
Your Ticket page.
Do you live in LA County? Was Zev
Yaroslavsky your County Supervisor? (He
represented the Third District, which includes the
central and western San Fernando Valley, Malibu, Santa
Monica, Venice, Beverly Hills, the City of West
Hollywood, and part of Hollywood.)

Sheila "Kuehl Cams" Kuehl, in 2007
During her career in the California
Legislature, Kuehl made three attempts to pass bills to allow
the use of automated speed enforcement (photo radar) in
California.
Kuehl has allowed the MTA to loot her own constituents via ultra heavy ticketing by MTA cameras along Canoga Avenue in Canoga Park. (See Set # 2 on the Metro/MTA Docs page.)
In 2016 she voted to put an additional LA County-wide sales tax, to go to Metro, on the Nov. 2016 ballot - and it passed. (See Measure M on the Action/Legis page, for more about that tax.)
Kuehl may be up for re-election in Nov. 2022.
Vote No on Donald Wagner
In 2014 Wagner was in the State Assembly and was the sponsor of Assembly Bill 2487 which would have taken away your right to a Trial de Novo.
In early 2015, while he still was in the Assembly, Wagner ran to jump over to the State Senate, but lost to John Moorlach. Early the next year he started another Senate run against fellow Republican Moorlach, but backed down after encountering heavy criticism from their Party followed by the Party's endorsement of his opponent. Later in 2016, when he was just months away from being termed-out of the Assembly, he ran for mayor of the City of Irvine, and won.

Former Asm. Donald Wagner
Then in March 2019 he ran to fill the
remaining year of the county supervisor seat formerly
occupied by Todd Spitzer, and narrowly beat Loretta
Sanchez.
In March 2020 he won a full term.
It's predictable that in 2024 Wagner will run for a
second full term.
Please don't reward him with your vote.
Be sure to read the "Countywide
Information" for OC, which is Docs Set # 6 on the Santa
Ana Documents page.
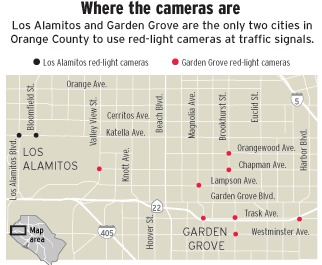
Map by OC Register, 7-6-16
Garden
Grove Docs Set # 1
Ticket Counts
Violations Recorded,
Notices Printed [7]
New 9-24-04, updated 1-8-20
| Cam # |
BRCH 01 |
BROR 01 |
BRWE 01 |
BRWE 03 |
CHBR 01 |
HATR 01 |
MATR 01 |
TRBR 01 |
TRBR 03 |
TRHA 01 |
TRMA 01 |
VACH 01 |
VACH 03 |
VVLA 01 |
|
|
|
||||||
| Brook- hurst SB@ Chap- man [5] Thru & Right |
Brook- hurst NB@ Orange- wood Thru & Right |
Brook- hurst SB@ West- minster Left |
Brook- hurst NB@ West- minster Left |
Chap- man WB@ Brook- hurst Left |
Harbor SB@ Trask Left |
Trask NB@ Mag- nolia Left |
Brook- hurst WB@ Trask Left |
Trask EB@ Brook- hurst Left |
Trask EB@ Harbor Mostly Right Turns |
Trask WB@ Mag- nolia Left |
Valley View NB or SB @ Chap- man [6] Thru & Right |
Valley View NB or SB @ Chap- man [6] Thru & Right |
Valley View SB@ Lamp- son Thru & Right |
[3] |
Total Cita- tions Issued as % of Events Recor- ded |
Total Viola- tions Recor- ded/ Notices Printed [1] [4] [7] |
Total Citations Issued/ Rolling Right Citations Per CVC 21455.5(i) Annual Reports [15] |
||||||
| Jan04 |
96 |
14 |
29 |
93 |
? |
260 |
6 |
23 |
? |
74 |
639 |
||||||||||||
| Feb04 |
145 |
41 |
64 |
120 |
95 |
167 |
8 |
40 |
18 |
100 |
798 |
||||||||||||
| Mar04 |
228 |
47 |
68 |
127 |
318 |
276 |
7 |
51 |
55 |
117 |
1294 |
||||||||||||
| Apr04 |
169 |
34 |
46 |
87 |
241 |
235 |
19 |
48 |
93 |
91 |
1063 |
||||||||||||
| May04 |
119 |
43 |
49 |
48 |
207 |
146 |
8 |
40 |
45 |
40 |
745 |
||||||||||||
| Jun04 |
103 |
48 |
54 |
6 |
36 |
55 |
13 |
8 |
14 |
18 |
355 |
||||||||||||
| Jul04 |
110 |
41 |
43 |
0 |
60 |
49 |
7 |
6 |
13 |
12 |
341 |
||||||||||||
| Aug04 |
178 |
[8] |
[8] |
14 |
49 |
82 |
4 |
78 |
8 |
23 |
436 |
||||||||||||
| Sep04 |
|
||||||||||||||||||||||
| Oct04 |
271 116 |
0 0 |
0 0 |
0 0 |
11 8 |
79 67 |
56 44 |
20 3 |
137 88 |
56 34 |
42 19 |
0 0 |
0 0 |
436 215 |
1108 594 |
||||||||
| Nov04 |
|
||||||||||||||||||||||
| Dec04 |
|
||||||||||||||||||||||
| 2004 |
|||||||||||||||||||||||
| Jan05 |
360 212 |
0 0 |
52 17 |
69 25 |
5 4 |
38 32 |
73 58 |
16 7 |
117 83 |
38 21 |
32 20 |
0 0 |
0 0 |
520 316 |
1320 795 |
||||||||
| Feb05 |
1104 660 |
||||||||||||||||||||||
| Mar05 |
1077 769 |
||||||||||||||||||||||
| Apr05 |
233 159 |
0 0 |
81 61 |
85 68 |
15 15 |
96 76 |
75 62 |
27 19 |
113 78 |
40 23 |
19 16 |
61 47 |
63 54 |
267 165 |
1175 843 |
||||||||
| May05 |
1571 1094 |
||||||||||||||||||||||
| Jun05 |
1496 991 |
||||||||||||||||||||||
| Jul05 |
198 127 |
57 13 |
59 35 |
81 64 |
14 8 |
0 0 |
76 59 |
103 66 |
25 14 |
141 60 |
121 48 |
183 113 |
239 175 |
248 148 |
1545 930 |
||||||||
| Aug05 |
|||||||||||||||||||||||
| Sep05 |
|||||||||||||||||||||||
| Oct05 |
202 124 |
125 61 |
19 6 |
37 24 |
7 7 |
0 0 |
82 61 |
70 43 |
18 5 |
100 64 |
54 26 |
145 98 |
184 100 |
233 159 |
1276 778 |
||||||||
| Nov05 |
|||||||||||||||||||||||
| Dec05 |
|||||||||||||||||||||||
| 2005 [2] |
504 (proj.) |
10290 (proj.) |
|||||||||||||||||||||
| Jan06 |
173 109 |
222 140 |
31 14 |
29 14 |
8 2 |
0 0 |
38 31 |
38 27 |
15 8 |
62 42 |
65 32 |
118 67 |
144 97 |
150 84 |
1093 667 |
||||||||
| Apr06 |
177 113 |
197 115 |
43 21 |
41 19 |
16 7 |
0 0 |
27 22 |
17 8 |
94 41 |
84 38 |
109 36 |
117 68 |
139 106 |
151 84 |
1212 678 |
||||||||
| Jul06 |
227 132 |
197 89 |
48 18 |
68 35 |
20 10 |
0 0 |
33 21 |
10 3 |
23 11 |
137 59 |
157 48 |
122 69 |
196 117 |
198 87 |
1436 699 |
||||||||
| Oct06 |
188 113 |
215 80 |
37 12 |
77 41 |
17 0 |
0 0 |
2 1 |
11 3 |
8 1 |
40 18 |
123 39 |
118 44 |
165 113 |
165 79 |
1166 544 |
||||||||
| 2006 [2] |
471 (proj.) |
7764 (proj.) |
|||||||||||||||||||||
| Jan07 |
165 96 |
152 70 |
40 20 |
50 22 |
16 13 |
0 0 |
5 4 |
1 0 |
10 3 |
29 15 |
89 37 |
79 48 |
141 98 |
114 75 |
891 501 |
||||||||
| Apr07 |
141 86 |
149 81 |
39 20 |
51 34 |
9 3 |
0 0 |
21 7 |
3 1 |
9 3 |
0 0 |
101 36 |
98 52 |
157 109 |
152 86 |
930 518 |
||||||||
| Jul07 |
148 86 |
174 107 |
60 27 |
57 35 |
21 10 |
1 0 |
0 0 |
4 0 |
20 8 |
0 0 |
114 41 |
110 66 |
137 86 |
169 83 |
1015 549 |
||||||||
| Oct07 |
130 81 |
133 75 |
65 20 |
71 43 |
18 2 |
170 90 |
74 36 |
9 0 |
14 3 |
3 2 |
20 9 |
76 45 |
120 80 |
124 75 |
1027 561 |
||||||||
| 2007 [2] |
51 (proj.) |
6387 (proj.) |
|||||||||||||||||||||
| Jan08 |
96 48 |
153 82 |
39 19 |
70 31 |
10 7 |
131 91 |
24 14 |
8 1 |
10 6 |
250 130 |
17 5 |
57 22 |
136 93 |
101 51 |
1102 600 |
||||||||
| Feb08 [9] |
119 85 |
244 113 |
95 48 |
976 590 |
|||||||||||||||||||
| Mar08 [9] |
154 92 |
267 141 |
117 75 |
1106 677 |
|||||||||||||||||||
| Apr08 [9] |
157 94 |
293 166 |
96 49 |
1160 699 |
|||||||||||||||||||
| May08 [9] |
170 113 |
222 100 |
125 79 |
1157 696 |
|||||||||||||||||||
| Jun08 [9] |
135 94 |
251 113 |
118 56 |
1132 647 |
|||||||||||||||||||
| Jul08 |
57 31 |
181 109 |
71 35 |
51 25 |
5 2 |
130 86 |
37 30 |
2 1 |
12 5 |
211 95 |
8 2 |
107 72 |
125 76 |
141 84 |
1138 653 |
||||||||
| Aug08 [9] |
94 80 |
216 103 |
134 83 |
1110 669 |
|||||||||||||||||||
| Sep08 [9] |
98 78 |
181 73 |
117 81 |
1024 649 |
|||||||||||||||||||
| Oct08 [9] |
117 82 |
190 77 |
131 85 |
1064 616 |
|||||||||||||||||||
| Nov08 [9] |
119 77 |
180 109 |
92 58 |
987 594 |
|||||||||||||||||||
| Dec08 [9] |
106 83 |
204 131 |
131 84 |
994 623 |
|||||||||||||||||||
| 2008 [2] |
1351 |
60% |
12950 7713 |
||||||||||||||||||||
| Jan09 |
75 35 |
142 68 |
31 11 |
34 21 |
7 5 |
103 61 |
32 14 |
4 2 |
8 3 |
190 106 |
8 2 |
60 43 |
91 72 |
119 84 |
904 527 |
||||||||
| Feb09 [9] |
77 56 |
171 84 |
114 66 |
722 422 |
|||||||||||||||||||
| Mar09 [9] |
94 45 |
265 170 |
120 72 |
962 593 |
|||||||||||||||||||
| Apr09 [9] |
93 55 |
249 149 |
89 42 |
983 571 |
|||||||||||||||||||
| May09 [9] |
55 23 |
287 176 |
135 67 |
1049 662 |
|||||||||||||||||||
| Jun09 [9] |
74 45 |
241 113 |
127 56 |
1014 515 |
|||||||||||||||||||
| Jul09 |
62 22 |
161 66 |
44 32 |
47 23 |
5 2 |
92 51 |
41 26 |
4 3 |
13 6 |
261 122 |
8 4 |
65 42 |
102 80 |
124 57 |
1029 536 |
||||||||
| Aug09 |
60 26 |
146 65 |
67 39 |
56 29 |
6 3 |
89 54 |
61 25 |
3 1 |
13 10 |
279 142 |
18 6 |
79 52 |
88 68 |
116 56 |
1081 576 |
||||||||
| Sep09 |
61 39 |
148 68 |
56 35 |
69 42 |
10 3 |
88 54 |
60 32 |
6 1 |
6 3 |
213 109 |
12 4 |
73 53 |
107 75 |
100 51 |
1009 569 |
||||||||
| Oct09 |
52 35 |
159 76 |
58 36 |
59 40 |
7 6 |
77 49 |
79 39 |
2 0 |
16 13 |
242 124 |
15 6 |
102 85 |
110 81 |
117 63 |
1095 653 |
||||||||
| Nov09 |
29 14 |
176 50 |
26 19 |
59 40 |
6 5 |
68 45 |
60 34 |
8 7 |
13 8 |
212 111 |
16 7 |
63 45 |
78 65 |
102 56 |
916 506 |
||||||||
| Dec09 |
0 0 |
112 71 |
27 21 |
38 26 |
8 8 |
91 60 |
45 23 |
1 0 |
12 11 |
121 57 |
30 7 |
44 34 |
74 65 |
102 65 |
705 448 |
||||||||
| 2009 [2] |
1463 |
57% |
11469 6578 |
||||||||||||||||||||
| Jan10 |
0 0 |
121 79 |
30 23 |
54 40 |
3 2 |
94 54 |
42 19 |
1 1 |
17 8 |
25 8 |
32 14 |
58 49 |
69 53 |
93 59 |
639 409 |
||||||||
| Feb10 |
0 0 |
153 81 |
31 14 |
44 31 |
6 3 |
55 36 |
46 18 |
5 1 |
8 5 |
0 0 |
23 7 |
50 39 |
65 59 |
79 43 |
565 337 |
||||||||
| Mar10 |
146 51 |
140 67 |
40 24 |
54 39 |
6 2 |
118 94 |
44 19 |
2 1 |
10 9 |
2 1 |
49 11 |
74 54 |
78 65 |
200 84 |
963 521 |
||||||||
| Apr10 |
96 47 |
146 70 |
25 15 |
51 38 |
7 3 |
117 85 |
42 24 |
5 5 |
14 11 |
159 66 |
24 5 |
79 64 |
118 102 |
240 73 |
1123 608 |
||||||||
| May10 |
97 33 |
138 68 |
25 14 |
74 55 |
8 3 |
162 110 |
52 30 |
2 1 |
20 16 |
123 49 |
25 6 |
105 83 |
111 83 |
241 91 |
1183 642 |
||||||||
| Jun10 |
73 29 |
144 71 |
37 13 |
50 39 |
4 0 |
152 104 |
69 38 |
6 2 |
13 9 |
144 59 |
31 13 |
54 40 |
50 33 |
223 55 |
1050 505 |
||||||||
| Jul10 |
117 32 |
141 56 |
48 25 |
37 30 |
7 3 |
160 106 |
74 37 |
2 1 |
13 11 |
131 38 |
26 7 |
39 20 |
37 12 |
222 59 |
1054 437 |
||||||||
| Aug10 |
128 38 |
184 88 |
62 34 |
71 55 |
11 3 |
143 82 |
89 36 |
3 1 |
13 9 |
141 33 |
47 13 |
47 30 |
43 33 |
231 62 |
1213 517 |
||||||||
| Sep10 |
393 68 |
121 54 |
40 21 |
51 40 |
5 1 |
144 92 |
89 30 |
5 2 |
12 7 |
131 58 |
36 14 |
50 30 |
52 38 |
150 50 |
1279 505 |
||||||||
| Oct10 |
206 71 |
95 51 |
40 22 |
69 37 |
7 5 |
160 113 |
89 40 |
7 6 |
13 8 |
139 67 |
28 7 |
35 25 |
38 31 |
227 91 |
1153 574 |
||||||||
| Nov10 |
|
119 54 |
998 449 |
||||||||||||||||||||
| Dec10 |
96 43 |
134 63 |
50 30 |
50 35 |
19 15 |
115 69 |
76 33 |
1 0 |
7 6 |
108 65 |
26 14 |
22 12 |
30 17 |
267 86 |
1001 488 |
||||||||
| 2010 [2] |
498 |
49% |
12221 5992 |
||||||||||||||||||||
| Jan11 |
135 46 |
77 34 |
52 37 |
39 29 |
13 11 |
107 69 |
75 34 |
5 1 |
15 12 |
110 57 |
28 18 |
38 34 |
25 17 |
206 65 |
925 464 |
||||||||
| Feb11 |
115 39 |
115 53 |
44 27 |
46 37 |
12 11 |
98 65 |
68 30 |
1 0 |
13 12 |
103 61 |
19 7 |
26 15 |
38 20 |
224 80 |
922 457 |
||||||||
| Mar11 |
132 49 |
135 53 |
48 29 |
55 36 |
9 5 |
109 69 |
64 36 |
5 2 |
13 8 |
131 78 |
21 13 |
35 20 |
40 28 |
277 109 |
1074 535 |
||||||||
| Apr11 |
127 55 |
137 69 |
72 35 |
61 40 |
7 4 |
146 85 |
73 27 |
4 2 |
11 5 |
150 71 |
21 8 |
51 24 |
46 33 |
140 44 |
1046 502 |
||||||||
| May11 |
132 50 |
173 80 |
93 58 |
36 27 |
10 3 |
179 114 |
78 45 |
2 1 |
14 9 |
172 91 |
16 4 |
37 20 |
43 34 |
247 85 |
1232 621 |
||||||||
| Jun11 |
143 51 |
129 48 |
99 52 |
83 52 |
5 1 |
106 54 |
66 29 |
4 3 |
12 5 |
181 75 |
26 12 |
48 29 |
48 35 |
237 90 |
1187 536 |
||||||||
| Jul11 |
147 50 |
118 46 |
105 47 |
64 39 |
11 6 |
176 99 |
68 22 |
4 0 |
21 12 |
157 63 |
26 8 |
44 22 |
45 27 |
276 80 |
1262 521 |
||||||||
| Aug11 |
147 59 |
161 75 |
120 75 |
83 64 |
9 5 |
149 93 |
75 32 |
5 0 |
11 6 |
211 109 |
48 10 |
42 18 |
40 35 |
305 113 |
1405 694 |
||||||||
| Sep11 |
173 65 |
186 72 |
80 46 |
80 68 |
8 5 |
134 88 |
91 41 |
5 3 |
14 11 |
180 90 |
35 10 |
37 22 |
36 30 |
230 74 |
1289 625 |
||||||||
| Oct11 |
152 58 |
160 71 |
102 53 |
87 60 |
13 4 |
155 97 |
89 39 |
3 3 |
23 19 |
161 74 |
63 23 |
44 25 |
43 31 |
277 69 |
1372 626 |
||||||||
| Nov11 |
185 62 |
132 57 |
63 25 |
44 34 |
5 3 |
142 81 |
73 38 |
8 6 |
14 8 |
164 77 |
20 6 |
39 22 |
37 27 |
265 83 |
1191 529 |
||||||||
| Dec11 |
153 9 |
138 30 |
115 24 |
72 7 |
9 1 |
122 29 |
72 20 |
0 0 |
23 5 |
174 18 |
29 6 |
39 7 |
43 10 |
317 20 |
1306 186 |
||||||||
| 2011 [2] |
864 |
44% |
14211 6296 |
||||||||||||||||||||
| Jan12 |
139 41 |
138 47 |
82 51 |
65 38 |
11 5 |
106 62 |
44 15 |
4 4 |
24 12 |
167 55 |
30 12 |
47 27 |
30 23 |
247 61 |
1134 453 |
||||||||
| Feb12 |
152 44 |
159 25 |
188 28 |
1151 269 |
|||||||||||||||||||
| Mar12 |
151 39 |
215 61 |
269 60 |
1429 445 |
|||||||||||||||||||
| Apr12 |
143 58 |
218 117 |
302 82 |
1391 574 |
|||||||||||||||||||
| May12 |
165 72 |
199 95 |
300 99 |
1475 644 |
|||||||||||||||||||
| Jun12 |
155 40 |
132 40 |
306 82 |
1514 531 |
|||||||||||||||||||
| Jul12 |
127 45 |
154 44 |
342 129 |
1601 705 |
|||||||||||||||||||
| Aug12 |
201 78 |
212 60 |
362 161 |
1737 763 |
|||||||||||||||||||
| Sep12 |
124 56 |
193 97 |
122 70 |
121 94 |
9 3 |
199 101 |
88 54 |
10 7 |
29 19 |
64 18 |
56 19 |
36 21 |
78 52 |
292 155 |
1421 766 |
||||||||
| Oct12 |
191 104 |
120 68 |
256 125 |
1412 759 |
|||||||||||||||||||
| Nov12 |
57 37 |
63 28 |
213 106 |
1092 540 |
|||||||||||||||||||
| Dec12 |
114 64 |
64 32 |
159 78 |
1022 546 |
|||||||||||||||||||
| 2012 [2] |
643 |
43% |
16379 6995 |
||||||||||||||||||||
| Jan13 |
37 14 |
1179 601 |
|||||||||||||||||||||
| Feb13 |
25 10 |
1180 576 |
|||||||||||||||||||||
| Mar13 |
43 11 |
1242 606 |
|||||||||||||||||||||
| Apr13 |
49 8 |
1196 563 |
|||||||||||||||||||||
| May13 |
34 7 |
1186 508 |
|||||||||||||||||||||
| Jun13 |
30 5 |
1214 600 |
|||||||||||||||||||||
| Jul13 |
484 211 |
1641 742 |
|||||||||||||||||||||
| Aug13 |
448 219 |
1575 710 |
|||||||||||||||||||||
| Sep13 |
491 299 |
1596 872 |
|||||||||||||||||||||
| Oct13 |
454 318 |
1472 830 |
|||||||||||||||||||||
| Nov13 |
379 199 |
1332 618 |
|||||||||||||||||||||
| Dec13 |
395 185 |
1379 515 |
|||||||||||||||||||||
| 2013 [2] |
1486 |
48% |
16192 7741 |
7727 2602 |
|||||||||||||||||||
| Jan14 |
93 32 |
154 51 |
109 49 |
100 50 |
11 2 |
120 20 |
54 18 |
9 4 |
23 14 |
369 183 |
26 15 |
0 0 |
0 0 |
116 32 |
1184 470 |
||||||||
| Feb14 |
360 201 |
1024 492 |
|||||||||||||||||||||
| Mar14 |
419 207 |
1286 570 |
|||||||||||||||||||||
| Apr14 |
421 203 |
1197 508 |
|||||||||||||||||||||
| May14 |
409 214 |
1340 678 |
|||||||||||||||||||||
| Jun14 |
130 37 |
231 56 |
164 62 |
123 55 |
14 5 |
118 41 |
77 24 |
7 2 |
25 4 |
431 160 |
23 11 |
100 34 |
107 39 |
194 68 |
1744 598 |
||||||||
| Jul14 |
145 50 |
215 59 |
139 50 |
76 27 |
21 14 |
208 58 |
64 21 |
17 3 |
25 8 |
391 194 |
16 9 |
133 56 |
102 47 |
250 104 |
1802 700 |
||||||||
| Aug14 |
147 48 |
212 61 |
170 71 |
84 48 |
16 5 |
328 64 |
126 45 |
9 3 |
26 9 |
452 198 |
21 5 |
114 42 |
136 53 |
265 123 |
37% |
2106 775 |
|||||||
| Sep14 |
170 53 |
185 59 |
170 82 |
72 46 |
22 10 |
325 66 |
118 48 |
14 8 |
22 8 |
404 191 |
60 20 |
117 57 |
132 74 |
283 156 |
42% |
2094 878 |
|||||||
| Oct14 |
148 51 |
188 68 |
176 83 |
90 53 |
15 5 |
388 147 |
38 11 |
11 4 |
19 7 |
411 207 |
46 24 |
104 53 |
125 71 |
285 159 |
46% |
2044 943 |
|||||||
| Nov14 |
168 43 |
244 51 |
133 47 |
82 28 |
14 5 |
341 93 |
54 11 |
5 2 |
18 2 |
344 107 |
43 14 |
106 38 |
98 32 |
233 74 |
29% |
1883 547 |
|||||||
| Dec14 |
109 17 |
112 26 |
115 29 |
84 40 |
14 6 |
180 59 |
31 3 |
4 0 |
8 2 |
338 110 |
27 10 |
37 11 |
67 26 |
188 79 |
32% |
1314 418 |
|||||||
| 2014 [2] |
1665 497 (proj.) |
2312 647 (proj.) |
1764 710 (proj.) |
1067 521 (proj.) |
191 78 (proj.) |
3012 822 (proj.) |
843 272 (proj.) |
114 36 (proj.) |
249 81 (proj.) |
2175 |
393 162 (proj.) |
1067 437 (proj.) |
1151 513 (proj.) |
2721 1193 (proj.) |
40% |
19018 7577 |
7579 2803 |
||||||
| Jan15 |
35 4 |
47 4 |
73 16 |
41 16 |
4 2 |
54 19 |
18 4 |
1 1 |
2 0 |
266 90 |
9 1 |
21 6 |
7 4 |
66 25 |
30% |
644 192 |
|||||||
| Feb15 |
0 0 |
0 0 |
70 19 |
39 12 |
6 1 |
129 49 |
28 9 |
4 1 |
7 2 |
245 96 |
15 5 |
10 3 |
6 1 |
66 26 |
36% |
625 224 |
|||||||
| Mar15 |
1 0 |
0 0 |
91 19 |
41 14 |
3 2 |
144 43 |
30 6 |
5 1 |
8 1 |
307 98 |
18 10 |
14 1 |
12 4 |
50 20 |
30% |
724 219 |
|||||||
| Apr15 |
2 1 |
38 21 |
80 22 |
50 28 |
3 0 |
131 52 |
23 10 |
5 3 |
6 1 |
237 113 |
31 17 |
18 10 |
15 10 |
55 28 |
46% |
694 316 |
|||||||
| May15 |
1 1 |
31 17 |
87 38 |
62 40 |
10 4 |
126 47 |
50 21 |
3 2 |
6 1 |
300 121 |
17 9 |
9 0 |
14 7 |
46 25 |
44% |
762 333 |
|||||||
| Jun15 [13] |
8 3 |
56 32 |
- - |
- - |
10 4 |
122 42 |
45 22 |
2 1 |
2 0 |
381 172 |
23 9 |
19 5 |
12 5 |
24 9 |
43% |
704 304 |
|||||||
| Jul15 |
5 3 |
43 28 |
89 63 |
41 25 |
15 8 |
137 54 |
45 23 |
9 3 |
5 0 |
344 158 |
26 10 |
33 13 |
16 8 |
57 32 |
49% |
865 428 |
|||||||
| Aug15 [13] |
16 6 |
54 30 |
- - |
- - |
21 10 |
118 54 |
41 17 |
4 1 |
8 3 |
277 115 |
13 3 |
16 10 |
13 6 |
62 38 |
46% |
643 293 |
|||||||
| Sep15 [13] |
15 9 |
43 19 |
- - |
- - |
21 12 |
104 41 |
28 6 |
6 4 |
7 2 |
397 259 |
26 13 |
11 6 |
22 14 |
67 41 |
57% |
747 426 |
|||||||
| Oct15 [13] |
10 7 |
26 10 |
- - |
- - |
16 7 |
113 60 |
100 28 |
0 0 |
0 0 |
180 116 |
37 21 |
20 9 |
28 16 |
66 46 |
54% |
596 320 |
|||||||
| Nov15 |
18 11 |
40 22 |
0 0 |
0 0 |
7 4 |
89 43 |
59 20 |
5 2 |
4 0 |
391 177 |
27 16 |
22 13 |
10 6 |
67 42 |
48% |
739 356 |
|||||||
| Dec15 |
10 5 |
48 22 |
0 0 |
0 0 |
13 7 |
93 36 |
86 27 |
6 2 |
5 1 |
438 203 |
36 14 |
23 8 |
24 13 |
65 34 |
44% |
847 372 |
|||||||
| 2015 [2] |
121 50 |
426 205 |
490 177 |
274 135 |
129 61 |
1360 540 |
553 193 |
50 21 |
60 11 |
3763 1718 |
278 128 |
216 84 |
179 94 |
691 366 |
44% |
8590 3783 |
3959 1916 |
||||||
| Jan16 |
14 11 |
42 19 |
70 42 |
29 14 |
11 6 |
100 48 |
53 13 |
11 2 |
6 1 |
327 149 |
47 6 |
13 7 |
20 10 |
85 46 |
828 374 |
||||||||
| Feb16 |
29 16 |
62 38 |
149 91 |
88 61 |
25 15 |
24 6 |
100 54 |
12 1 |
11 2 |
552 241 |
44 11 |
22 7 |
24 11 |
62 37 |
1204 591 |
||||||||
| Mar16 |
16 8 |
52 36 |
170 116 |
76 41 |
20 9 |
172 86 |
76 36 |
13 3 |
7 2 |
326 155 |
38 7 |
28 8 |
26 19 |
92 52 |
1112 578 |
||||||||
| Apr16 |
21 13 |
51 28 |
163 101 |
118 83 |
8 7 |
133 69 |
86 47 |
13 0 |
10 2 |
563 223 |
59 15 |
25 16 |
25 9 |
100 60 |
1375 673 |
||||||||
| May16 |
19 8 |
62 35 |
154 107 |
91 53 |
25 14 |
71 43 |
75 27 |
19 5 |
17 3 |
547 236 |
45 12 |
30 15 |
30 18 |
108 58 |
1293 634 |
||||||||
| Jun16 |
13 8 |
50 34 |
126 79 |
111 70 |
4 1 |
232 136 |
59 30 |
11 2 |
10 1 |
539 225 |
34 9 |
30 13 |
34 18 |
104 59 |
1357 685 |
||||||||
| Jul16 |
21 11 |
18 12 |
148 105 |
105 71 |
24 13 |
258 152 |
83 40 |
16 1 |
12 3 |
569 266 |
31 6 |
31 14 |
20 10 |
92 45 |
1428 749 |
||||||||
| Aug16 |
26 12 |
52 36 |
119 73 |
105 78 |
19 10 |
265 166 |
66 27 |
10 1 |
18 1 |
695 347 |
42 10 |
30 14 |
21 11 |
82 48 |
1550 834 |
||||||||
| Sep16 |
26 15 |
38 23 |
88 31 |
108 67 |
32 13 |
229 141 |
62 23 |
2 0 |
24 8 |
435 206 |
51 19 |
34 13 |
23 15 |
84 51 |
1236 625 |
||||||||
| Oct16 |
18 8 |
52 33 |
79 38 |
110 65 |
18 8 |
249 135 |
77 23 |
5 2 |
23 6 |
689 345 |
61 13 |
22 8 |
19 9 |
116 58 |
1538 751 |
||||||||
| Nov16 [14] |
17 6 |
51 36 |
78 38 |
103 63 |
10 7 |
258 138 |
- - |
4 2 |
15 9 |
409 203 |
30 12 |
37 7 |
36 19 |
120 74 |
1168 614 |
||||||||
| Dec16 [14] |
25 9 |
54 34 |
116 68 |
94 58 |
21 10 |
245 148 |
- - |
13 4 |
18 8 |
382 129 |
45 10 |
29 11 |
28 14 |
88 62 |
1158 565 |
||||||||
| 2016 [1] |
245 125 |
584 364 |
1460 889 |
1138 724 |
217 113 |
2236 1268 |
884 384 (proj.) |
129 23 |
171 46 |
6033 2725 |
527 130 |
331 133 |
306 163 |
1133 650 |
51% |
14510 7353 |
7576 3006 |
||||||
| Jan17 [14] |
21 5 |
55 31 |
75 44 |
48 28 |
22 10 |
262 155 |
- - |
11 3 |
10 1 |
39 3 |
30 7 |
37 11 |
26 11 |
107 48 |
743 357 |
||||||||
| Feb17 [14] |
19 8 |
43 26 |
109 53 |
20 12 |
26 17 |
206 112 |
- - |
16 1 |
25 9 |
169 53 |
40 5 |
23 8 |
35 17 |
81 46 |
812 367 |
||||||||
| Mar17 [14] |
25 12 |
44 30 |
253 149 |
110 67 |
20 9 |
241 146 |
- - |
15 2 |
5 1 |
204 95 |
56 13 |
32 10 |
31 21 |
114 62 |
1150 617 |
||||||||
| Apr17 [14] |
33 16 |
59 27 |
198 118 |
112 71 |
23 9 |
214 129 |
- - |
10 3 |
2 0 |
502 278 |
66 18 |
28 8 |
22 17 |
120 71 |
1389 765 |
||||||||
| May17 [14] |
15 10 |
55 35 |
193 116 |
118 74 |
10 6 |
236 143 |
- - |
5 1 |
19 5 |
546 290 |
74 18 |
28 11 |
37 22 |
101 64 |
1437 795 |
||||||||
| Jun17 [14] |
21 9 |
54 33 |
241 151 |
144 87 |
30 13 |
250 138 |
- - |
6 1 |
2 0 |
593 323 |
34 3 |
28 14 |
31 17 |
114 84 |
1548 873 |
||||||||
| Jul17 [9] |
1284 664 |
||||||||||||||||||||||
| Aug17 [9] |
1557 806 |
||||||||||||||||||||||
| Sep17 [9] |
1587 818 |
||||||||||||||||||||||
| Oct17 [9] |
1436 769 |
||||||||||||||||||||||
| Nov17 [9] |
1452 796 |
||||||||||||||||||||||
| Dec17 [9] |
1474 892 |
||||||||||||||||||||||
| 2017 [1] |
263 131 |
689 392 |
2196 1194 |
1436 884 |
289 131 |
2450 1411 |
796 285 |
126 22 |
114 27 |
5313 2814 |
623 121 |
399 161 |
379 232 |
1304 827 |
53% |
16413 8643 |
8643 3300 |
||||||
| Jan18 |
22 12 |
52 38 |
142 83 |
128 85 |
11 6 |
127 72 |
73 38 |
2 0 |
16 0 |
500 334 |
73 13 |
30 15 |
40 21 |
81 53 |
1297 770 |
||||||||
| Feb18 |
18 12 |
59 39 |
154 90 |
134 92 |
12 8 |
95 56 |
97 48 |
1 1 |
22 3 |
543 341 |
65 15 |
46 22 |
41 22 |
93 63 |
1380 812 |
||||||||
| Mar18 |
19 12 |
75 52 |
204 116 |
145 96 |
10 4 |
147 88 |
89 59 |
14 3 |
15 5 |
672 412 |
107 38 |
38 16 |
31 18 |
79 56 |
1645 975 |
||||||||
| Apr18 |
23 12 |
42 22 |
168 108 |
157 113 |
11 7 |
167 99 |
79 47 |
11 2 |
12 2 |
729 447 |
80 24 |
29 18 |
41 26 |
99 65 |
1648 992 |
||||||||
| May18 |
22 12 |
49 27 |
190 112 |
169 104 |
7 6 |
151 87 |
66 44 |
16 2 |
14 2 |
731 439 |
78 12 |
39 18 |
38 25 |
86 63 |
1656 953 |
||||||||
| Jun18 |
30 16 |
63 40 |
235 148 |
198 118 |
18 13 |
168 96 |
108 66 |
10 2 |
15 5 |
732 428 |
104 27 |
35 15 |
33 19 |
127 79 |
1876 1072 |
||||||||
| Jul18 |
32 18 |
63 40 |
236 142 |
192 139 |
15 9 |
144 79 |
89 53 |
5 1 |
13 4 |
786 482 |
82 25 |
35 16 |
36 13 |
112 69 |
1840 1090 |
||||||||
| Aug18 |
24 15 |
65 33 |
230 129 |
205 135 |
23 13 |
158 79 |
70 41 |
20 4 |
13 6 |
821 494 |
83 25 |
34 17 |
32 20 |
126 87 |
1904 1098 |
||||||||
| Sep18 |
23 15 |
73 43 |
226 82 |
173 119 |
0 0 |
155 80 |
124 55 |
16 0 |
13 3 |
523 286 |
75 13 |
37 12 |
46 29 |
114 78 |
1598 815 |
||||||||
| Oct18 |
18 13 |
103 46 |
210 73 |
219 136 |
7 2 |
130 66 |
100 36 |
11 0 |
17 4 |
694 418 |
74 21 |
34 9 |
35 15 |
114 65 |
1766 904 |
||||||||
| Nov18 |
25 13 |
38 25 |
177 82 |
187 130 |
11 3 |
113 66 |
75 37 |
4 2 |
18 3 |
576 363 |
65 27 |
36 15 |
31 19 |
123 79 |
1479 864 |
||||||||
| Dec18 |
28 16 |
73 32 |
165 105 |
161 105 |
14 6 |
122 53 |
151 70 |
3 3 |
21 8 |
627 342 |
68 25 |
37 15 |
36 27 |
114 76 |
1620 883 |
||||||||
| 2018 [1] |
284 166 |
755 437 |
2337 1270 |
2068 1372 |
139 77 |
1677 921 |
1121 594 |
113 20 |
189 45 |
7934 4786 |
954 265 |
430 188 |
440 254 |
1268 833 |
57% |
19709 11228 |
11228 5136 |
||||||
| Jan19 |
16 10 |
87 54 |
185 138 |
175 127 |
13 9 |
99 59 |
131 78 |
14 1 |
27 7 |
549 313 |
77 14 |
36 13 |
31 23 |
88 55 |
1528 901 |
||||||||
| Feb19 |
628 420 |
1509 1015 |
|||||||||||||||||||||
| Mar19 |
613 405 |
1659 1110 |
|||||||||||||||||||||
| Apr19 |
587 359 |
1727 1112 |
|||||||||||||||||||||
| May19 |
782 564 |
1882 1325 |
|||||||||||||||||||||
| Jun19 |
632 501 |
1675 1244 |
|||||||||||||||||||||
| Jul19 |
40 31 |
155 107 |
173 121 |
175 135 |
9 1 |
127 82 |
118 91 |
14 1 |
13 4 |
887 713 |
71 17 |
30 19 |
40 32 |
126 82 |
1978 1436 |
||||||||
| Aug19 |
33 26 |
164 102 |
171 116 |
157 113 |
13 9 |
156 99 |
105 76 |
15 2 |
16 4 |
845 653 |
32 8 |
38 18 |
36 26 |
119 80 |
1900 1332 |
||||||||
| Sep19 |
18 16 |
127 66 |
112 77 |
154 119 |
15 9 |
150 89 |
127 86 |
3 1 |
8 4 |
777 600 |
33 9 |
28 8 |
35 25 |
119 86 |
1706 1195 |
||||||||
| Oct19 |
11 7 |
103 59 |
174 98 |
221 165 |
14 13 |
135 89 |
77 48 |
12 5 |
6 4 |
825 630 |
40 16 |
23 10 |
49 36 |
120 79 |
1810 1259 |
||||||||
| Nov19 |
|||||||||||||||||||||||
| Dec19 |
|||||||||||||||||||||||
| 2019 [2] (proj. based upon July - Oct.) |
306 240 |
1647 1002 |
1890 1236 |
2121 1596 |
153 96 |
1704 1077 |
1281 903 |
132 27 |
129 48 |
10002 7788 |
528 150 |
357 165 |
480 357 |
1452 981 |
71% |
22182 15666 |
15666 8567 |
||||||
| 2019 [2] (proj. based upon Jan. - Oct.) |
8550 6189 |
69% |
20849 14315 |
14315 6808 |
|||||||||||||||||||
| Cam # |
BR CH 01 |
BROR 01 |
BRWE 01 |
BRWE 03 |
CHBR 01 |
HATR 01 |
MATR 01 |
TRBR 01 |
TRBR 03 |
TRHA 01 |
TRMA 01 |
VACH 01 |
VACH 03 |
VVLA 01 |
|
A |
B |
C |
|||||
| Brook- hurst SB@ Chap- man [5] Thru & Right |
Brook- hurst NB@ Orange- wood Thru & Right |
Brook- hurst SB@ West- minster Left |
Brook- hurst NB@ West- minster Left |
Chap- man WB@ Brook- hurst Left |
Harbor SB@ Trask Left |
Trask NB@ Mag- nolia Left |
Brook- hurst WB@ Trask Left |
Trask EB@ Brook- hurst Left |
Trask EB@ Harbor Mostly Right Turns |
Trask WB@ Mag- nolia Left |
Valley View NB or SB @ Chap- man [6] Thru & Right |
Valley View NB or SB @ Chap- man [6] Thru & Right |
Valley View SB@ Lamp- son Thru & Right |
[3] |
Total Cita- tions Issued as % of Events Recor- ded |
Total Viola- tions Recor- ded/ Notices Printed [1] [4] [7] |
Total Citations Issued/ Rolling Right Citations Per CVC 21455.5(i) Annual Reports [15] or Projec- tion [2] |
This table made by highwayrobbery.net, using official monthly reports of citations actually issued.
Official reports, Jan. 2008 to July 2009
Official reports Aug. 2009 to July 2010
Official reports Oct. 2010 to Dec. 2011
Official reports Oct. 2004 to Jan. 2012
Official reports Feb. 2012 to Nov. 2012
Official reports, Nov. 2012 to Dec. 2012
Official reports, Nov. 2010 to May 2013
Official reports, July 2013 to Aug. 2013
Official reports, June 2013 to July 2014
Official reports, May 2005 & Sep. 2014
Official reports, Feb. 2005 to Mar. 2015
Official reports, Apr. 2015 to May 2015
Official report, July 2015
Official reports, June 2015 to Nov. 2015
Official reports, Nov. 2015 to Jan. 2016
Official reports, Feb. 2016 to June 2016
Official reports, July 2016 to Oct. 2016
Official reports, Nov. 2016 to June 2017 [14]
Official reports, Oct. 2017 to May 2018
Official reports, June & July 2018
Official reports, July 2018 to Jan. 2019
Official reports, Feb. 2019 to Oct. 2019
[ ] indicates a footnote.
[1] Totals are as provided by the City.
[2] Annual totals, or annual projections, are by highwayrobbery.net and are based on just the data posted in the table. Until the official CVC 21455.5(i) report becomes available in Fall 2020, the 2019 column C figure for rolling right turns will be a projection, based upon TRHA-1 ticketing plus 10%.
[3] Un-used columns are to allow for later expansion of City's system.
[4] Jan. 2004 counts are incomplete.
[5] Enforcement on right and left turns has been indicated, when known. However, the absence of a "Rt" or "Left" indication does not necessarily mean that there is no enforcement on turns at that intersection.
[6] The compass direction of enforcement, and/or the movement ("thru," "right," "left") noted here may be incorrect.
[7] Except where noted otherwise, the figures given in the table are for the single calendar month indicated.
Figures in red type and not enclosed in parentheses (or, if you are looking at this table in black and white, the upper figure when there are two or more rows of figures in a cell) are what RedFlex calls Total Processed Incidents or Total Violations, and represent Total Detections (all incidents flashed by the camera) minus Nonprosecutable incidents.
Any figures in (red) type enclosed in parentheses are Total Detections. and come from the official report entitled RTS Management Report (example) which, beginning in 2013, highwayrobbery.net will be requesting from all cities.
The figures in black type are what the city calls Notices Printed, and represent the sum of genuine citations issued (those filed with the court) plus any Nominations mailed (not filed with the court, a.k.a. Snitch Tickets).
Due to time limitations, complete figures have been posted only for selected months or cameras. If there is sufficient public interest, the remaining months or cameras will be posted.
[8] Not in operation due to construction.
[9] All data has been received (see links, above) but only a portion has been posted, due to time limitations.
[10] Data for this month was requested in:.
[11] The title bar has been repeated solely for the convenience of the reader -
there is no difference between it and the one at the top of the table.
[12] The official report for this month was generated less than ten days after the end of the month. As a result, many violations were still "in progress" and the eventual number of "approved violations" would be expected to be greater than the number shown in the official report. Before being posted in the table above, the figures given in the official monthly report were adjusted by assuming that the "in progress" violations would be approved in the same proportion that violations were approved during the previous calendar year.
[13] The BRWE cameras were not listed in the official reports for these months but still may have been in operation.
[14] The reports for these months did not include data for MATR-01 as it may have been inactive at the time the reports were run.
[15] From the annual reports required, beginning with 2013, by CVC 21455.5(i). They become available by the Fall of the following year.
Signal Timing Charts & Speed Surveys
To see all the timing charts and speed surveys I have received, go to Timing Charts - Garden Grove Docs.
Garden Grove Docs Set # 3
Non-Compliant Signs Replaced
Until late Summer 2006, the warning signs at some Garden Grove intersections were much smaller than the required warning signs (see Defect # 4), didn't carry the required symbol or language, or were placed on the far side of the intersection instead of in advance.
Now the City has replaced them with the proper signs.
Contract & Installation Dates
New contract signed in 2007
In Feb. 2012 the City agreed to a six-month extension, to Aug. 2012.
In July 2012 the City approved (staff report and minutes) a three-year extension plus two automatic one-year extensions (unless, 60 days in advance of the expiration dates the City notifies RedFlex of its intent not to extend).
Contract extensions should never be automatic - this is not a contract for cable TV!
In 2015 the the deadline to stop the first of the two automatic extensions was looming, so on June 9 the city council discussed (staff report) the continuation of the camera program. The city manager described the purpose of the discussion as follows.
"The Mayor has expressed an interest in taking an in-depth look at the effectiveness of the red light camera program including but not limited to cost, accident reduction, community impact, liability considerations, etc. The intent behind the request is to schedule this for a future City Council meeting or Study Session so that all of the information related to this program can be made available to the City Council and the public. Consequently, we will not be generating reports for Tuesday's meeting but discussing the topic generally with the intent of setting a date & time specific in the future..."
On June 23 a Voice of OC article (archived copy) headlined "Garden Grove Might Nix Red Light Cameras" said that the council's action had been to request a review of the program - at a later date. They did not vote to send a 60-day notice to RedFlex, so missed the deadline to stop the first of the two one-year extensions from occurring, and lost the opportunity to bargain for a better price. The City would have to continue to pay $2279 per camera per month - way too much (see invoices) - until June 2016.
Example of lower prices: In March 2014 the City of Elk Grove, California approved a new contract which specified the following schedule of rents for their five RedFlex cameras.
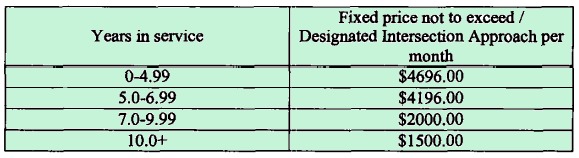
From Exh. D of the Elk
Grove Contract
To cover that extra rent, Garden Grove will need to issue an extra 1309 tickets during the year (assuming that the City receives an average of $100 for each ticket issued).
The council expressed concern about questions raised in two letters from the public (SaferStreetsLA Report highwayrobbery.net email), so ordered staff to do a further study of accident rates.
Aug. 2015 Register Editorial (archived copy)
The next review occurred at the Oct. 27 council meeting. (Staff Report (15MB) SaferStreetsLA Report highwayrobbery.net email)
The accident study was approved by a 3 - 2 vote.
(Minutes)
Oct. 30, 2015 Editorial (archived copy)
Nov. 5, 2015 Article (archived copy)
It appears that in June 2016 the second (and last) one-year extension occurred automatically, allowing the program to continue until Aug. 2017.
Early 2017 invoices showed that the City continues to pay $2279 per camera.
2017: Another Four years.
At the July 25, 2017 council meeting they approved 5 - 0 (O'Neill and Bui absent) a four year extension of the program.
Staff Report
Our Letter
Fully Executed Contract
Early 2018 invoices showed that the City was paying $2200 per camera, a 3% reduction.
Garden Grove Docs Set # 5
"Late Time" Graphs
The City provided bar graphs of Late Times, etcetera, for all fourteen cameras.
These graphs track violations recorded, not tickets issued.
Where there is a large number of long Late Time violations in a curb lane - like there is at TRHA-1 - it is believed to indicate heavy ticketing on right turns.
(The curb lane will be the lane with the highest lane number.)
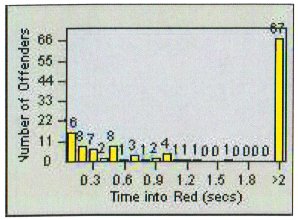
The picture above is an example from another city.
BRCH-01 Jan. 2008
BRCH-01 July 2009
BRCH-01 Oct. 2011
BROR-01 Jan. 2008
BROR-01 July 2009
BROR-01 Oct. 2011
BRWE-01 Jan. 2008
BRWE-01 July 2009
BRWE-01 Oct. 2011
BRWE-03 Jan. 2008
BRWE-03 July 2009
BRWE-03 Oct. 2011
CHBR-01 Jan. 2008
CHBR-01 July 2009
CHBR-01 Oct. 2011
HATR-01 Jan. 2008
HATR-01 July 2009
HATR-01 Oct. 2011
MATR-01 Jan. 2008
MATR-01 July 2009
MATR-01 Oct. 2011
TRBR-01 Jan. 2008
TRBR-01 July 2009
TRBR-01 Oct. 2011
TRBR-03 Jan. 2008
TRBR-03 July 2009
TRBR-03 Oct. 2011
TRHA-01 Jan. 2008
TRHA-01 July 2009
TRHA-01 Oct. 2011
TRMA-01 Jan. 2008
TRMA-01 July 2009
TRMA-01 Oct. 2011
VACH-01 Jan. 2008
VACH-01 July 2009
VACH-01 Oct. 2011
VACH-03 Jan. 2008
VACH-03 July 2009
VACH-03 Oct. 2011
VVLA-01 Jan. 2008
VVLA-01 July 2009
VVLA-01 Oct. 2011
All Cameras, Oct.2012
All Cameras, July 2014
All Cameras, Nov. 2015
All Cameras, Oct. 2016
All Cameras, May 2018
All Cameras, Oct. 2019
Bar graphs are available for more than fifty other cities - see the list in the expanded version of Defect # 9.
Garden Grove Docs Set # 6
Accident
History
Accident
History
Garden Grove Docs Set # 7
Info on GGPD
Site
I was not able to find red light camera program info at the police department's website.
Garden Grove Docs Set # 8
Grand Jury Report
The 2004 - 2005 OC Grand Jury did a report on red
light cameras. That report, and the cities'
(required) responses, are on the Grand Jury's reports
page.
Garden Grove Docs Set # 9
More Coming
There may be some more Garden Grove information posted
in the next few weeks. Mark your calendar to
remind you to come back here and look!
---------------------------------
RED LIGHT CAMERAS
www.highwayrobbery.net
www.highwayrobbery.net