If
you haven't already done so, please read the Napa
section on the Camera Towns page
Napa
Documents (Program Ending Early 2017)
Some of Napa's tickets can possibly be
ignored. If your "ticket" does not have the Napa
County Superior Court's name and address on it, it is a
fake ticket, what I call a "Snitch Ticket." For
more details, see the Snitch Ticket section on the
Your Ticket page.
On Jan. 17, 2017, the City Council voted to end the program. See Set # 3, below.
Do you live in the South end of Alameda
County or the North end of Santa Clara County - State
Sen. Ellen Corbett's former District?
In late 2014 Sen. Corbett termed out,
and was replaced by this person

R. A. Wieckowski, Author of the
anti-motorist bill AB
666
who will be running for re-election in
2018 and 2022.
Please don't vote for him.
Napa
Docs Set # 1
Ticket
Counts
Total
Violations, Notices Printed [3]
| Cam # |
1212 01 |
1212 01 |
1212 01 |
BRTR 01 |
JEFI 01 |
SOIM 01 |
|
||
| Column # |
1 |
2 |
3 |
4 |
5 |
6 |
7 |
||
[5] |
Hwy 29/121 SB@ Hwy 12 All Movements [11] (From RedFlex- generated table) [6] [7] |
Hwy 29/121 SB@ Hwy 12 Right Turns Only (From Agenda Item 28A - see footnote 8) [6] [7] [8] |
Hwy 29/121 SB@ Hwy 12 Right Turns Only (From Agenda Item 28B - see footnote 9) [6] [7] [9] |
Trancas EB@ Big Ranch Road/ Soscol Thru & Left (From RedFlex- generated table) |
Jeffer- son SB@ First St. Thru & Right (From RedFlex- generated table) |
Hwy 221/ Napa Vallejo Highway/ Soscol NB@ Imola Thru & Left (From RedFlex- generated table) |
Total Citations Issued as % of Events Re- cord |
Total Violations Recorded/ Notices Printed [1] [3] (From RedFlex- generated table) |
|
| Apr09 |
0 0 |
3 1 |
19 12 |
0 0 |
59% |
22 13 |
|||
| May09 |
0 0 |
90 62 |
334 290 |
0 0 |
83% |
424 352 |
|||
| Jun09 |
0 0 |
160 100 |
313 254 |
0 0 |
75% |
473 354 |
|||
| Jul09 |
0 0 |
113 75 |
272 217 |
0 0 |
76% |
385 292 |
|||
| Aug09 |
0 0 |
92 63 |
271 216 |
363 279 |
|||||
| Sep09 |
61 41 |
||||||||
| Oct09 |
101 68 |
||||||||
| Nov09 |
45 33 |
||||||||
| Dec09 |
66 45 |
||||||||
| 2009 |
2554 (proj.) |
||||||||
| Jan10 |
0 0 |
62 48 |
178 153 |
217 176 |
82% |
457 377 |
|||
| Feb10 |
80 19 |
78 55 |
36 27 |
142 123 |
218 179 |
73% |
476 348 |
||
| Mar10 |
1831 916 |
1733 - |
1978 855 |
51 33 |
184 156 |
289 223 |
56% |
2355 1328 |
|
| Apr10 |
1243 479 |
1147 - |
1432 423 |
43 30 |
179 140 |
237 184 |
49% |
1702 833 |
|
| May10 [6] |
1441 975 |
1382 - |
1582 947 |
63 35 |
185 133 |
278 195 |
68% |
1967 1338 |
|
| Jun10 |
1104 426 |
1039 - |
1155 397 |
50 28 |
163 135 |
248 179 |
49% |
1565 768 |
|
| Jul10 |
971 408 |
888 - |
1016 362 |
61 41 |
145 112 |
226 152 |
51% |
1403 713 |
|
| Aug10 |
750 299 |
671 - |
754 257 |
66 44 |
179 143 |
269 179 |
53% |
1264 665 |
|
| Sep10 |
637 214 |
559 - |
635 181 |
71 46 |
164 133 |
119 79 |
48% |
991 472 |
|
| Oct10 [7] |
615 217 |
535 - |
682 171 |
59 42 |
145 118 |
41 35 |
48% |
860 412 |
|
| Nov10 |
794 297 |
727 - |
828 263 |
42 32 |
157 130 |
175 127 |
50% |
1168 586 |
|
| Dec10 [7] |
673 237 |
610 - |
730 201 |
43 25 |
151 133 |
198 162 |
52% |
1065 557 |
|
| 2010 [2] |
10139 4487 |
647 431 |
1972 1609 |
2515 1870 |
15273 8397 |
||||
| Jan11 |
616 174 |
562 - |
656 139 |
46 27 |
104 87 |
133 107 |
44% |
899 395 |
|
| Feb11 |
574 143 |
533 - |
605 120 |
31 23 |
91 68 |
155 117 |
41% |
851 351 |
|
| Mar11 |
578 157 |
- - |
602 118 |
43 37 |
113 97 |
137 107 |
46% |
871 398 |
|
| Apr11 |
622 160 |
- - |
635 130 |
46 27 |
113 84 |
175 127 |
42% |
956 398 |
|
| May11 |
677 172 |
- - |
707 149 |
65 34 |
115 77 |
202 133 |
39% |
1059 416 |
|
| Jun11 |
612 0 |
51 0 |
135 0 |
221 0 |
0% |
1019 0 |
|||
| Jul11 |
64 0 |
62 0 |
134 0 |
278 0 |
0% |
538 0 |
|||
| Aug11 |
44 14 |
49 22 |
117 91 |
379 256 |
65% |
589 383 |
|||
| Sep11 |
74 29 |
55 36 |
120 84 |
357 274 |
70% |
606 423 |
|||
| Oct11 |
67 49 |
48 26 |
99 75 |
345 262 |
74% |
559 412 |
|||
| Nov11 |
76 49 |
55 29 |
99 74 |
252 185 |
70% |
482 337 |
|||
| Dec11 |
69 54 |
34 20 |
116 88 |
251 177 |
72% |
471 339 |
|||
| 2011 [2] |
4073 1001 |
585 281 |
1356 825 |
2885 1745 |
8899 3852 |
||||
| Jan12 |
80 55 |
34 25 |
116 91 |
210 166 |
77% |
440 337 |
|||
| Feb12 |
77 54 |
32 28 |
126 114 |
264 197 |
79% |
499 393 |
|||
| Mar12 |
80 53 |
45 30 |
138 118 |
256 199 |
77% |
519 400 |
|||
| Apr12 |
52 35 |
34 24 |
139 111 |
251 178 |
73% |
476 348 |
|||
| May12 |
50 34 |
40 30 |
135 119 |
337 238 |
75% |
562 421 |
|||
| Jun12 |
52 34 |
58 41 |
101 88 |
315 233 |
75% |
526 396 |
|||
| Jul12 |
53 39 |
48 36 |
102 82 |
337 229 |
71% |
540 386 |
|||
| Aug12 |
60 38 |
65 46 |
100 78 |
345 234 |
69% |
570 396 |
|||
| Sep12 |
72 53 |
38 31 |
107 86 |
363 271 |
76% |
580 441 |
|||
| Oct12 |
64 43 |
46 35 |
102 81 |
360 275 |
572 434 |
||||
| Nov12 |
60 43 |
43 29 |
100 85 |
267 202 |
470 359 |
||||
| Dec12 |
34 24 |
42 25 |
104 84 |
260 213 |
440 346 |
||||
| 2012 [2] |
734 505 |
525 380 |
1370 1137 |
3565 2635 |
6194 4657 |
||||
| Jan13 |
45 29 |
39 32 |
87 67 |
216 174 |
387 302 |
||||
| Feb13 |
46 32 |
45 31 |
109 86 |
245 190 |
445 339 |
||||
| Mar13 |
47 32 |
47 26 |
143 121 |
257 191 |
494 370 |
||||
| Apr13 |
51 36 |
54 36 |
125 104 |
308 232 |
538 408 |
||||
| May13 |
53 37 |
59 42 |
139 125 |
300 225 |
551 429 |
||||
| Jun13 |
67 53 |
60 43 |
115 86 |
279 194 |
521 376 |
||||
| Jul13 |
77 54 |
53 35 |
129 110 |
306 213 |
565 412 |
||||
| Aug13 |
84 63 |
76 53 |
121 110 |
360 259 |
641 485 |
||||
| Sep13 |
67 45 |
65 40 |
127 100 |
312 227 |
571 412 |
||||
| Oct13 |
59 36 |
69 38 |
107 90 |
360 262 |
595 426 |
||||
| Nov13 |
42 35 |
34 25 |
103 78 |
176 122 |
355 260 |
||||
| Dec13 |
43 32 |
43 28 |
105 79 |
143 108 |
334 247 |
||||
| 2013 [2] |
681 484 |
644 429 |
1410 1156 |
3262 2397 |
5997 4466 |
||||
| Jan14 |
38 24 |
43 26 |
95 80 |
90 66 |
266 196 |
||||
| Feb14 |
49 38 |
35 22 |
82 69 |
285 202 |
451 331 |
||||
| Mar14 |
55 39 |
35 26 |
0 0 |
273 195 |
363 260 |
||||
| Apr14 |
13 4 |
58 36 |
[12] |
293 215 |
364 255 |
||||
| May14 |
1 1 |
61 36 |
[12] | 361 274 |
423 311 |
||||
| Jun14 |
75 46 |
53 39 |
[12] | 360 271 |
488 356 |
||||
| Jul14 |
52 35 |
49 30 |
[12] |
216 145 |
317 210 |
||||
| Aug14 |
98 59 |
63 41 |
[12] | 170 116 |
331 216 |
||||
| Sep14 |
66 46 |
55 37 |
[12] | 377 272 |
498 355 |
||||
| Oct14 |
77 47 |
48 29 |
[12] | 310 220 |
435 296 |
||||
| Nov14 |
51 35 |
48 36 |
[12] | 290 224 |
389 295 |
||||
| Dec14 |
40 30 |
45 32 |
[12] | 319 255 |
404 317 |
||||
| 2014 [2] |
615 404 |
593 390 |
177 149 |
3344 2455 |
4729 3398 |
||||
| Jan15 |
39 28 |
40 30 |
[12] | 104 73 |
183 131 |
||||
| Feb15 |
43 29 |
30 24 |
[12] | 61 45 |
134 98 |
||||
| Mar15 |
52 31 |
39 29 |
[12] | 93 65 |
184 125 |
||||
| Apr15 [13] |
52 38 |
41 25 |
0 0 |
126 95 |
219 158 [13] |
||||
| May15 |
55 47 |
56 38 |
97 77 |
128 70 |
336 232 |
||||
| Jun15 |
49 35 |
60 38 |
176 141 |
120 82 |
405 296 |
||||
| Jul15 |
49 34 |
92 58 |
191 150 |
94 68 |
426 310 |
||||
| Aug15 [14] |
49 29 |
52 38 |
193 157 |
106 74 |
400 298 |
||||
| Sep15 [14] |
77 54 |
52 38 |
157 121 |
118 86 |
404 299 |
||||
| Oct15 [14] |
50 32 |
38 29 |
208 149 |
126 99 |
422 309 |
||||
| Nov15 [14] |
50 32 |
41 26 |
159 122 |
113 75 |
363 255 |
||||
| Dec15 |
42 27 |
30 24 |
85 62 |
106 77 |
263 190 |
||||
| 2015 [2] |
607 416 |
571 397 |
1266 979 |
1295 909 |
3739 2701 |
||||
| Jan16 |
34 24 |
22 17 |
54 45 |
105 90 |
215 176 |
||||
| Feb16 |
46 32 |
46 32 |
75 64 |
92 66 |
259 194 |
||||
| Mar16 |
32 21 |
32 22 |
82 64 |
136 99 |
282 206 |
||||
| Apr16 |
50 26 |
33 19 |
85 70 |
169 118 |
337 233 |
||||
| May16 |
42 28 |
78 38 |
116 88 |
174 112 |
410 266 |
||||
| Jun16 |
47 30 |
95 46 |
109 78 |
227 157 |
478 311 |
||||
| Jul16 |
67 49 |
82 44 |
116 94 |
165 115 |
430 302 |
||||
| Aug16 |
75 52 |
95 50 |
121 97 |
241 165 |
532 364 |
||||
| Sep16 |
53 44 |
86 55 |
121 103 |
197 129 |
457 331 |
||||
| Oct16 |
86 61 |
90 51 |
113 99 |
244 170 |
533 381 |
||||
| Nov16 |
|||||||||
| Dec16 |
|||||||||
| 2016 [2] (proj.) |
638 440 (proj.) |
791 449 (proj.) |
1190 962 (proj.) |
2100 1465 (proj.) |
4720 3317 (proj.) |
||||
| Cam # |
1212 01 |
1212 01 |
1212 01 |
BRTR 01 |
JEFI 01 [12] |
SOIM 01 |
|
This table made by highwayrobbery.net, using reports provided by the City under the California Public Records Act.
The RedFlex-generated reports for Apr. 2009 to Apr. 2010 are included in Docs Set # 2, below.
RedFlex-generated reports for Apr. - Jun. 2010
NPD table prepared for Item 28A of 6-21-11 city council meeting [8]
NPD table prepared for Item 28B of 6-21-11 city council meeting [9]
The RedFlex-generated reports for Jan. - Mar. 2011 are included in Docs Set # 2, below.
RedFlex-generated reports for Feb. - Oct. 2011
RedFlex-generated reports for Oct. - Dec. 2011
RedFlex-generated reports for Jan. - Sept. 2012
RedFlex-generated reports for 2012 - 2013
RedFlex-generated reports for late 2013
RedFlex-generated reports for 2009 and early 2014
RedFlex-generated reports for Spring 2014
RedFlex-generated report for July 2014
RedFlex-generated reports for 2014 - 2015
RedFlex-generated reports for Apr. - Nov. 2015
RedFlex-generated reports for Dec. 2015 - June 2016
RedFlex-generated reports for Fall 2016
[ ] indicates a footnote.
[1] Totals are as provided by the City.
[2] This annual total, or annual projection, is by highwayrobbery.net.
[3] Any figures in red type (or, if you are looking at this table in black and white, the upper figure when there are two or more figures in a cell) are Total Violations, or all incidents recorded by the cameras, and due to time limitations may have been posted here only for selected months or locations. If there is sufficient public interest, the remaining months will be posted. The figures in black type are Notices Printed, and represent the sum of genuine citations issued (those filed with the court) plus any Nominations mailed (not filed with the court, a.k.a. Snitch Tickets).
[4] Monthly RedFlex-generated table has not been requested from the City.
[5] Details of direction of enforcement provided 11-14-11 by a local resident..
[6] On May 13, 2010 CalTrans lengthened the yellow at Hwy 29/Hwy121. If you have a ticket there, see Docs # 4, below.
[7] In its June 2011 response to the Mar. 2011 Grand Jury report, the City revealed that in Oct. 2010, and then again in Dec. 2010, it had effectively lengthened the yellow for rolling rights at Hwy 29/Hwy121. Read more in Docs # 4, below.
[8] Column # 2 was added on 6-19-11. The City prepared two tables for the city council meeting of June 21. Figures in Col. 2 above are from the table the City prepared (linked above) for Agenda Item 28A for the city council meeting of 6-21-11. *The City's table indicated that information for these months was not available at the time the report was written.
[9] Column # 3 was added on 6-19-11. Figures in Col. 3 above are from the table the City prepared (linked above) for Agenda Item 28B for the city council meeting of 6-21-11. Neither of the reports accompanying the June 2011 tables explains why the 28B table's figures for total right-turn-on-red violations ("RTOR Violations") in April-June 2010 exceed the figures for all violations (shown in Col. 1 above) obtained from the RedFlex-generated table (linked above) covering those months. Nor do we know why the 28B RTOR Violations do not agree with the RTOR Violations in Item 28A. Nor do we know why the number of citations issued at 29/121 during the first quarter 2011, as reported in the RedFlex-generated table (474), is 26% more than the 28B total (377) for the same three months.
[10] Official monthly reports not yet available.
[11] Right turn enforcement at this intersection ended in June 2011, so enforcement is only on the two southbound thru lanes.
[12] This camera was removed, temporarily, in early 2014. Article It was re-activated in May 2015. Article
[13] The report for this month was generated just a few days after the end of the month, so the number of tickets issued may be low.
[14] There was a big refund/dismissal of tickets issued between Aug. 1 and Dec. 2, 2015. See Set # 4, below.
Current Highlights in Napa
1. In Napa, the percentage of Cites Issued (vs. Events Recorded) is unusually high.
2. The big refund/dismissal of tickets issued between Aug. 1 and Dec. 2, 2015. And the other refunds/dismissals. See Set # 4, below.
3. The reincarnation of SOIM. In Jan. 2015 CalTrans lengthened the yellow there and ticketing immediately dropped by about 2/3, and stayed low for fifteen months; but then in Apr. 2016 the number of tickets started increasing, and by June 2016 it had doubled. See also Set # 8, below.
4. The 2015 - 2017 slow motion change of camera suppliers. See Set # 3, below.
"Late Time" Graphs
The City has provided bar graphs (or tables) of Late Times, etcetera, for all of its cameras.
These graphs track violations recorded, not tickets issued.
Where there is a large number of long Late Time violations in a curb lane, it is believed to indicate heavy ticketing on right turns.
(The curb lane will be the lane with the highest lane number.)
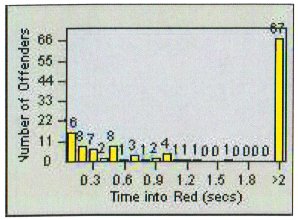
The picture above is an example from another city.
Graphs, May 2009
Graphs, April 2010, and RedFlex-generated Ticket Counts, Apr. 2009 to Apr. 2010
Graphs, April - June 2010
New-style table of Late Times, and RedFlex-generated Ticket Counts, Jan. to Mar. 2011
Graphs, Feb. 2010 to Oct. 2011
Graphs, Sept. 2011, 1212
Graphs, Sept. 2011, BRTR
Graphs, Sept. 2011, JEFI
Graphs, Sept. 2011, SOIM
Graphs, all cameras, Sept. 2012
Graphs, all cameras, Sept. 2013
Tabular version, all cameras, Nov. 2015
Bar graphs are available for more than fifty other cities - see the list in the expanded version of Defect # 9.
Napa Docs Set # 3
The
Contract
The Price!
The 500 Dismissals
$1/2 Million Wasted
Program Ending Early 2017
2008
Draft Contract, with Staff Report
2008 Contract,
Signed
The 2008 contract included a "cost
neutrality" clause, whereby the city did not have to pay
RedFlex the full rent if the fines were insufficient to
cover the cost. See Subsection B. of Defect # 10.
The 2008 contract penalized the City if it chose not to
enforce right-hand turn violations.
The contract also says: Definitions.
"Warning Period" means the period of thirty (30)
days after the Installation Date of each
intersection approach. (Emphasis added.) See
Defect # 6.
Per an article
in the Napa Valley Register, on May 26, 2011 the
Appellate Division of the Napa County Superior Court
found Napa's cost neutrality clause to be
illegal.
At its June 21,
2011 meeting, the city council voted 4 - 1 (Techel:
nay) to amend the contract to remove cost neutrality
(and the requirement for right turn enforcement), and
to extend the term to Jun. 2012. The staff
report for the June 21 meeting is available here.
The amendment
was signed on Jul. 21. In
a July 25, 2011 Register article, the City disclosed
that it would resume issuing tickets on approx. Aug. 1.
The City filed a Petition for Re-hearing of the appeal
decision (under Rule
of
Court 8.889), and re-hearing was granted. The
court suspended all action
on current red light camera tickets, until Sept. 12. On Aug. 12, 2011
the judge again found the contract to be illegal, but
also ruled that the illegality would not negate RedFlex'
evidence so long as the prosecution proves that the
evidence has not been altered. The
documents in this appeal case are available here.
Per an Oct. 8,
2011 Register article,
the City was dismissing 500 still-pending (not yet
paid) tickets issued under the old illegal
contract. (See the earlier Grand Jury
recommendation, in Set # 4, below.) The Register
said that Capt. Jeff Troendly said that already-paid
tickets in closed cases would not be refunded.
(The quantity of tickets to be dismissed seemed low,
because 500 tickets would represent just over one
month's worth of tickets, or about 4% of all tickets
issued, and it is unusual for a court to have a 96%
payment rate.)
See the South San Francisco page, and Set # 2 on
the Home page, for other examples of large
refunds/dismissals.
Reviewing the Contract Price: Pound Foolish, Penny
Wise
While
the
July
2011
amendment
contains
a
good
feature
-
it
allows
the
City
to
cancel
the
contract
with
only
10
days
notice
- the City failed to negotiate the
price, leaving the monthly rent for each of the
cameras at $6000.
Many cities pay less than half of that (see FAQ # 17).
Compared to a reasonable target rent of $3000, Napa
agreed to pay $144,000 too much over the year, enough to
pay two police officers' salaries.
During the same meeting, the council voted to cut their
own council salaries, by about $3930.
Late 2011 invoices
showed that Napa was paying for four cameras.
Renewing in 2012 and again in 2013: More
Money Wasted
In June 2012 the
police chief signed a one-year contract
extension. A July 6, 2012 Napa Valley
Register article
revealed that while he got the rent reduced to $1500 on
one camera, he agreed to continue paying $5670 and $6000
on the other three. Compared to a target rent of
$3000, Napa agreed to pay $86,040 too much over the
year, enough to pay a police officer's salary.
In June 2013 the
chief signed another one-year extension, to June
2014. He did not negotiate the price, so wasted
another $86,040.
FAQ # 17 has many
more examples of what other California cities pay for
their cameras.
Summer
2014: Contract Extended
The contract
expired in June 2014, and a staff
report prepared for the June 17 council meeting
asked the council to approve a three-month extension to
give the police extra time to do a study.
The delay was costly. The City continued to pay
the existing high rent during the extra three
months, $21,510 flushed down the drain.
At the meeting the council approved the three-month
extension, by a 4 - 1 vote (nay: Techel, who
opposes cameras).
Rent Money Wasted,
As of Late 2014:
$144,000 in 2011 -
2012
$86,040 in 2012 - 2013
$86,040 in 2013 - 2014
$21, 510 during three month extension in 2014
The next council
meeting about the cameras was Aug. 19, 2014.
The staff
report prepared for that meeting revealed that
75% of all tickets go to visitors.
At that meeting the council approved another
one-year extension of the cameras, on a 3 - 2 vote
(nays: Techel and Mott).
They got an 8%
discount, to $17,700 per month for all four cameras,
thus reducing the overpayment of rent to $68,400 during
the year (when compared to a $3000 target price).
Total wasted, so far: $405,990. The
City gets about $100 of fine money from each ticket
issued, so it will issue an extra 4060 tickets to
cover that extra rent.
2015 -
2017: Changing Vendors?
Slowly ! (More Money Wasted)
A staff
report prepared for the May 19, 2015 council
meeting recommended an approximate six-month extension
to give the police extra time so that the contract to
operate the cameras - which was due to expire
in Aug. 2015 - could be put out to bid. The
council voted 4 - 1 (Mott: nay) to authorize the
city manager to extend the contract on a month-to-month
basis.
The deadline for
the competing cameras companies to submit their bids was
Dec. 30, 2015, so in Jan. or Feb. 2016 there should have
been a city council discussion of the bids.
Instead, in Aug. 2016 the City extended
the old contract to Feb. 2017 as they apparently still
were thinking about which bid to
accept - if any.
Late 2016 invoices
show that the City still is paying RedFlex $17,700 per
month. So, by Feb. 2017 the City will have
overpaid by at least another $102,600, for a new total
of $508,590. Or maybe even more than that; as of
Apr. 2016 the cameras were seven years old, so it could
be argued that the new target rent from then to Feb.
2017 should be $2000 per camera (using the prices Elk
Grove negotiated - see FAQ # 17). That adjustment
would add $44,000 to the amount wasted, for a new total
of $552,590.
Program Ending Early 2017
At its meeting of
Jan. 17th the Napa City Council voted 4 - 1 (nay:
Sedgley)
to end the program.
Main
Staff Report
Staff
Report Tables and Graphs
Proposed
Contract
Proposed
Resolution
My Letter to
the Council
SaferStreetsLA
Letter to the Council
Post-vote
Article (archived
copy)
Set # 3 was up-to-date as of Jan. 18, 2017.
Napa Docs Set # 4
Mass
Refunds/Dismissals
Mar. 2011: Grand Jury
Recommends 1000 Refunds at 29/121
City's Response: No
Oct. 2011: City Asks for
500 Dismissals Because of Illegal Contract
Dec. 2015: Refunds Needed at
Jefferson/First - Yellow Too Short
City's Response: Did It !
Our Response: More Refunds Needed
The Mar. 2011 (Recommended) Refund
On May 13, 2010 CalTrans
lengthened the yellow at the Hwy. 29/121
intersection, from 3.2 seconds, up to 3.8.
Correspondence
between
City and CalTrans
Despite the longer yellow,
a record 940 right turn tickets were issued there
that month.
In Mar. 2011 the Napa County Grand Jury issued a report
recommending, among other things, 1000 refunds at
29/121.
Over the weekend of Mar. 26 and 27, 2011 the Napa
Valley Register published an article
and an editorial
about the Grand Jury report.
In its June 2011 response
to the Mar. 2011 Grand Jury report, the City revealed
that in Oct. 2010, and then again in Dec. 2010, it had
effectively lengthened the yellow for rolling rights at
Hwy 29/Hwy121. The June 2011 response said:
"In October 2010 and later in December,
2010, the City began issuing citations
to right turn violators only if the light had been yellow
for 5.0 (October) and 5.4 (December) seconds
prior to the violation."
In that same response, it said it would
not make the refunds recommended by the Grand
Jury.
Overall, the City rejected 6-1/2 of the 8 recommendations made by the Grand Jury.
If you would like to read some grand jury reports from other counties, about their red light cameras, see the Grand Jury entry in the Site Index.
The Oct. 2011 Dismissals
In Oct. 2011 the City asked for the
dismissal of 500 tickets, because of the illegal
contract. See Set # 3, above.
Dec. 2015 Refunds
Napa was four months late providing the
longer yellows required by a recent CalTrans rule change
(see Set # 2 on the Home page), and that delay caused
the unwarranted issuance of red light camera tickets to
many motorists.
Technical details: The speed
survey for Jefferson at First showed an 85th
Percentile speed of 31 which, under the new rule, required
a yellow of at least 3.6 seconds, while the signal timing
charts suggested that the change from the previous 3.3
setting to the current 3.7 setting did not occur until
early December 2015, four months after the August 1, 2015
deadline set by CalTrans.
Ticketing at the intersection dropped 49% between November
and December - and January 2016 was even lower yet -
consistent with the yellow being lengthened in early
December.
The City disclosed that of the tickets
issued between Aug. 1 and Dec. 2, it asked the court to
refund 196 that had already been paid at the time the
too-short yellow was discovered. The City also
asked the court to dismiss the tickets that had not yet
been paid.
(a)
At an intersection at which there is an automated
enforcement system in operation, the minimum
yellow light change interval shall be established in
accordance with the California Manual on
Uniform Traffic Control Devices.
(b)
For purposes of subdivision (a), the minimum yellow light
change intervals relating to
designated approach speeds provided in the California
Manual on Uniform Traffic Control
Devices are mandatory minimum yellow light
intervals. (Emphasis
added.)
Napa Docs Set # 5
Encroachment
Permits
Some of the City's cameras are located on CalTrans
right-of-ways, so are operated under an encroachment
permit obtained from CalTrans.
HighwayRobbery.net obtained these documents from
CalTrans, via a public records request.
Permit Application (not available
yet)
Correspondence (not available yet)
Issued
Permit,
Nov. 2009
Some other cities operate cameras under
encroachment permits. For more information
about those cities and about CalTrans' criteria for
the issuance of an encroachment permit, see the
CalTrans section on the Links page.
Napa Docs Set # 6
"Statistics"
Presented
to City Council
On Feb. 15, 2011
the police department made a presentation to the City Council,
updating them on the red light camera program.
The staff report claimed:
"The cameras are serving
the intended purpose of reducing collisions."
The presentation also
included several police-produced tables with
headings suggesting that there was a reduction in
accidents attributable to the installation of the
cameras.
An examination of the those
tables (below) shows that the police's own
statistics do not support their claims.
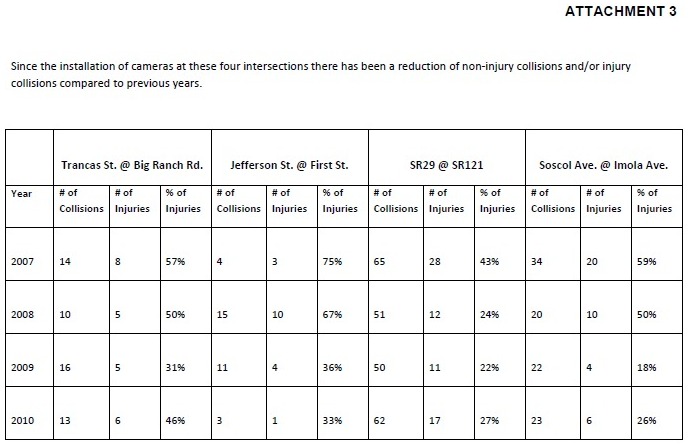
Police-produced attachment to Feb.
15, 2011 report to Napa city council.
Comment by
highwayrobbery.net: Examination of Attachment
3 reveals that if you compare 2010 to 2008 (2008
being the last full year before cameras were
installed and 2010 being the only full year with
cameras), collisions went up at three of the
four intersections having cameras, and injuries went
up at two and down at two. Attachment
3 does show a big drop in collisions at
three of the four intersections, but it occurred in
2008, before cameras were installed, so
cannot be attributed to the cameras.
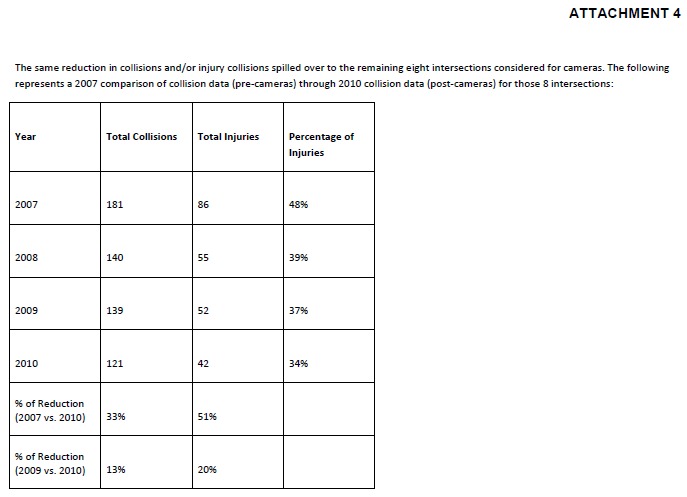
Police-produced attachment to Feb.
15, 2011 report to Napa city council.
Comment by
highwayrobbery.net: Attachment 4, which
covers the other intersections originally
considered for cameras, shows that the big drop is
between 2007 and 2008, before cameras were
installed, just like Attachment 3 shows for the
intersections where cameras were eventually
installed.
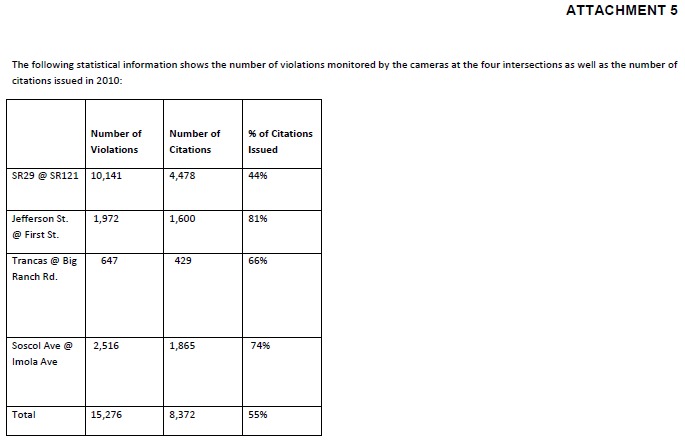
Police-produced attachment to Feb.
15, 2011 report to Napa city council.
Comment by
highwayrobbery.net: Attachment 5 is
interesting but tells us nothing about safety, as
the quantity of violations is under direct control
of City staff and/or the camera company. With
a few keystrokes they can change the length of the
yellow light (for straight through movements) or,
for right turns, lower the Threshold (or "trigger")
Speed. From a peer-reviewed academic study:
"Another type of research flaw in some RLC studies is the use of a process measure, such as violations or traffic citations, instead of an actual safety outcome, e.g., crashes or injuries. Unlike crashes, citations are 'endogenous,' meaning officials responsible for issuing citations directly control the number issued."
And It Gets Worse!
In June 2011, the
police
department prepared two tables for the city council
meeting of June 21. One of the new tables was an
attachment to Agenda Item 28A, the City's (required)
response to March's Grand Jury report. The other
new table was an attachment to Agenda Item 28B, a City
staff report recommending that the program be
continued. Two new columns have been added to the
big Ticket Count table (Docs Set # 1, above on this web
page), in order to display figures from the City's new
tables alongside figures from the RedFlex-generated
tables we obtained in 2010.
The reports accompanying the City's new tables do not
explain why the figures for total right turn violations
("RTOR Violations") in April, May and June 2010 (from
the table attached to Agenda Item 28B) exceed the
figures for all violations obtained from the
RedFlex-generated table covering those months.
Nor do we know why the 28B RTOR Violations do not agree
with the RTOR Violations shown in Agenda Item
28A.
Nor do we know why the 28B total for the number of
citations issued at 29/121 during first quarter 2011
(377), is 20% less than the number reported in the
RedFlex-generated table (474) covering that quarter.
All of the tables are available at the links in
the footnotes of Docs Set # 1, above.
Napa Docs Set #
7
Napa:
The
(Cold & Dark?) Heart of the Wine Country
Visitors: Watch Out!
On Mar. 19, 2013 a Register
article disclosed that as much as 76% of the
City's camera tickets go to visitors, and that at the
one intersection where the minority of tickets
go to visitors, injury collisions increased 50% over
five years. The
staff
report prepared for an Aug. 2014 council meeting
reported that 75% of all camera tickets go to visitors.
On Feb. 15, 2011 the Napa Valley Register
printed a letter from a visitor from Oklahoma, who
complained about getting a ticket for a rolling
right while she and her husband were in Napa
celebrating his retirement. She wrote:
"Our
memory... of your beautiful valley has been
tainted by the cold-heartedness of the situation."
The cold-heartedness doesn't seems to be
confined to the camera robots and the Napa
police. Consider some of the responses her
letter prompted:
Bauhausfan commented: "I
am just fine with you not being back... all of us
will feel OK with that also."
Alucawanza commented: "Cry me a river."
DowntownNapan commented: "Adios, and don't
let the door hit you too hard or your way out of
Napa."
On
Dec. 13, 2011 the Register had a letter from a tourist
from Las Vegas, who had brought a party of twenty
people to Napa. He noted:
"I
spent $5000 the three days I was in Napa.
Because of this unreasonable fine, I will never return
to your city."
Consider
some
of the responses from the locals:
KiddoYoung commented: "Please, cry me a
river."
Tsgets commented: "And since you asked, I
don't care if you return or not."
Napa
Docs Set # 8
Soscol/Imola
Keeping
Program in the Black?
A Nov. 13, 2011
Register
article about the financial condition of Napa's red
light camera program noted the big Fall 2011
increase in ticketing at Soscol/Imola, and that
Lt. Troendly suggested it was a seasonal
variation.
(The data in the Ticket Counts table above shows
no similar increase the previous Fall.)
See also the Current Highlights, just
below the Ticket Counts Table.
Napa Docs Set # 9
Prevailing
Wage Action
RedFlex' construction work in Napa was the subject of a
Prevailing
Wage action by the California Department of
Industrial Relations.
Napa Docs Set #
10
More
Coming
There may be
some more Napa information posted in the next few
weeks. Mark your calendar to remind you to
come back here and look!
---------------------------------
RED LIGHT
CAMERAS
www.highwayrobbery.net
www.highwayrobbery.net